Bitget: Global kunlik savdo hajmi bo'yicha top 4!
BTC bozor ulushi61.85%
Bitgetda yangi listinglar : Pi
BTC/USDT$104219.86 (+1.18%)Qo'rquv va ochko'zlik Indeksi70(Ochko'zlik)
Altcoin mavsumi indeksi:0(Bitcoin mavsumi)
Jami spot Bitcoin ETF sof oqimi +$321.4M (1K); +$2.02B (7K).6200 USDT qiymatidagi yangi foydalanuvchilar uchun xush kelibsiz sovg'a to'plami.Hoziroq oling
Bitget ilovasi yordamida istalgan vaqtda va istalgan joyda savdo qiling. Hozir yuklab oling


Sky narxiSKY
Ro'yxatga olingan
Kotirovka valyutasi:
UZS
so'm1,004.18+6.38%1D
SKY dan UZS ga konvertori
SKY
UZS
1 SKY = 0.00 UZS
Bitget barcha yirik savdo platformalari orasida eng past tranzaksiya to'lovlarini taklif qiladi. Sizning VIP darajangiz qanchalik yuqori bo'lsa, tariflar shunchalik qulay bo'ladi.
Narx jadvali
TradingView
Bozor kapitali
Sky narx diagrammasi (SKY/UZS)
Oxirgi yangilanish: 2025-05-11 02:23:22(UTC+0)
Bozor kapitali:--
To’liq suyultirilgan bozor kapitali:--
Hajm (24s):so'm94,108,931,584.35
24s hajm / bozor qiymati:0.00%
24s yuqori:so'm1,025.57
24s past:so'm939.69
Hamma vaqtdagi eng yuqori:so'm1,315.69
Hamma vaqtdagi eng past:so'm444.89
Aylanma ta'minot:-- SKY
Jami ta'minot:
23,463,144,887SKY
Aylanma tezligi:0.00%
Maksimal ta'minot:
--SKY
BTC'dagi narx:0.{6}7439 BTC
ETH'dagi narx:0.{4}3039 ETH
BTC bozor kapitallashuvidagi narxi:
--
ETH bozor kapitallashuvidagi narxi:
--
Shartnomalar:
0x5607...DEd9279(Ethereum)
Ko’proq
Bugun Sky haqida qanday fikrdasiz?
Izoh: Ushbu ma'lumot faqat ma'lumot uchun.
Sky bo'yicha AI tahlili hisoboti
Bugungi kripto bozorining diqqatga sazovor joylariHisobotni ko'rish
UZSda bugungi Sky jonli narxi
Jonli Sky narxi bugungi kunda so'm1,004.18 UZS tashkil etadi, joriy bozor qiymati so'm0.00. Sky narxi so'nggi 24 soat ichida 6.38% ga ko'tarildi va 24 soatlik savdo hajmi so'm94.11B. SKY/UZS (Sky dan UZS ga) ayirboshlash kursi real vaqtda yangilanadi.
Sky narx tarixi (UZS)
Sky narxi o'tgan yil davomida +15.57% ni tashkil qiladi. O'tgan yildagi SKYning UZS dagi eng yuqori narxi so'm1,315.69 va o'tgan yildagi SKYning UZS dagi eng past narxi so'm444.89 edi.
VaqtNarx o'zgarishi (%) Eng past narxEng yuqori narx
Eng past narxEng yuqori narx 24h+6.38%so'm939.69so'm1,025.57
7d+23.24%so'm764.97so'm1,025.57
30d+42.68%so'm708.64so'm1,025.57
90d+108.40%so'm479.31so'm1,025.57
1y+15.57%so'm444.89so'm1,315.69
Hamma vaqt+11.72%so'm444.89(2025-02-03, 97 kun oldin )so'm1,315.69(2024-12-03, 159 kun oldin )
Skyning eng yuqori narxi qancha?
2024-12-03da qayd etilgan Sky-ning UZSdagi eng yuqori (ATH) narxi so'm1,315.69 edi. Sky ATH bilan solishtirganda, Sky-ning joriy narxi 23.68% ga pasaygan.
Sky ning eng past narxi qancha?
2025-02-03da qayd etilgan Sky-ning UZSdagi eng past (ATL) narxi so'm444.89 edi. Sky ATH bilan solishtirganda, Sky-ning joriy narxi 125.72% ga ko'tarilgan.
Sky narx bashorati
Qachon SKYni sotib olish yaxshiroq? Hozir SKYni sotib olishim yoki sotishim kerakmi?
SKY sotib olish yoki sotish haqida qaror qabul qilayotganda, avvalo o'zingizning savdo strategiyangizni hisobga olishingiz kerak. Uzoq muddatli treyderlar va qisqa muddatli treyderlarning savdo faoliyati ham har xil bo'ladi. Bitget SKY texnik tahlili sizga savdo uchun ma'lumotnoma berishi mumkin.
SKY 4s texnik tahlil ga ko'ra, savdo signali Faol sotib olish.
SKY 1k texnik tahlil ga ko'ra, savdo signali Faol sotib olish.
SKY 1h texnik tahlil ga ko'ra, savdo signali Faol sotib olish.
2026 da SKY narxi qanday bo'ladi?
SKY tarixiy narx bajarilishini bashorat qilish modeli asosida SKY narxi 2026 da so'm878.34 ga yetishi prognoz qilinmoqda.
2031 da SKY narxi qanday bo'ladi?
2031 da SKY narxi +23.00% ga o'zgarishi kutilmoqda. 2031 oxiriga kelib, SKY narxi so'm1,564.33 ga yetishi prognoz qilinmoqda, jami ROI +63.11%.
TTSS
Sky ning hozirgi narxi qancha?
Skyning jonli narxi (SKY/UZS) uchun so'm1,004.18, joriy bozor qiymati so'm0 UZS. Kripto bozorida 24/7 doimiy faoliyat tufayli Sky qiymati tez-tez o'zgarib turadi. Skyning real vaqtdagi joriy narxi va uning tarixiy maʼlumotlari Bitget’da mavjud.
Sky ning 24 soatlik savdo hajmi qancha?
Oxirgi 24 soat ichida Sky savdo hajmi so'm94.11B.
Skyning eng yuqori koʻrsatkichi qancha?
Skyning eng yuqori ko‘rsatkichi so'm1,315.69. Bu Sky ishga tushirilgandan beri eng yuqori narx hisoblanadi.
Bitget orqali Sky sotib olsam bo'ladimi?
Ha, Sky hozirda Bitget markazlashtirilgan birjasida mavjud. Batafsil koʻrsatmalar uchun foydali sky qanday sotib olinadi qoʻllanmamizni koʻrib chiqing.
Sky ga sarmoya kiritish orqali barqaror daromad olsam bo'ladimi?
Albatta, Bitget savdolaringizni avtomatlashtirish va daromad olish uchun aqlli savdo botlari bilan strategik savdo platformasi ni taqdim etadi.
Eng past toʻlov bilan Sky ni qayerdan sotib olsam boʻladi?
strategik savdo platformasi endi Bitget birjasida mavjud ekanligini ma’lum qilishdan mamnunmiz. Bitget treyderlar uchun foydali investitsiyalarni ta'minlash uchun sanoatning yetakchi savdo to'lovlari va tubanligini taklif qiladi.
Sky yangiliklari
Sky bozori
Sky kontsentratsiya bo'yicha xoldinglar
Kitlar
Investorlar
Chakana savdo
Saqlash vaqti bo'yicha Sky manzil
Xolderlar
Kruizerlar
Treyderlar
Jonli coinInfo.name (12) narx grafigi

Global Sky narxlari
Hozirda boshqa valyutalarda Sky qancha turadi? Oxirgi yangilanish: 2025-05-11 02:23:22(UTC+0)
SKY dan MXN
Mexican Peso
Mex$1.51SKY dan GTQGuatemalan Quetzal
Q0.6SKY dan CLPChilean Peso
CLP$72.28SKY dan HNLHonduran Lempira
L2.02SKY dan UGXUgandan Shilling
Sh284.01SKY dan ZARSouth African Rand
R1.41SKY dan TNDTunisian Dinar
د.ت0.23SKY dan IQDIraqi Dinar
ع.د101.71SKY dan TWDNew Taiwan Dollar
NT$2.34SKY dan RSDSerbian Dinar
дин.8.01SKY dan DOPDominican Peso
RD$4.55SKY dan MYRMalaysian Ringgit
RM0.33SKY dan GELGeorgian Lari
₾0.21SKY dan UYUUruguayan Peso
$3.23SKY dan MADMoroccan Dirham
د.م.0.72SKY dan OMROmani Rial
ر.ع.0.03SKY dan AZNAzerbaijani Manat
₼0.13SKY dan SEKSwedish Krona
kr0.75SKY dan KESKenyan Shilling
Sh10.01SKY dan UAHUkrainian Hryvnia
₴3.22- 1
- 2
- 3
- 4
- 5
Sky(SKY) qanday sotib olinadi

Bepul Bitget hisobingizni yarating
Bitgetda elektron pochta manzilingiz/mobil telefon raqamingiz bilan ro'yxatdan o'ting va hisobingizni himoya qilish uchun kuchli parol yarating.

Hisobingizni tasdiqlang
Shaxsiy ma'lumotlaringizni to'ldirib va haqiqiy fotosuratli shaxsni tasdiqlovchi hujjatni yuklab, shaxsingizni tasdiqlang.

Sky ni SKY ga konvertatsiyalang
Bitgetda savdo qilish uchun kriptovalyutalardan tanlang.
Batafsil ma'lumotElita treyderlarini kuzatib borish orqali SKY nusxasi savdosiga qo'shiling.
Bitgetda ro'yxatdan o'tganingizdan va USDT yoki SKY tokenlarini muvaffaqiyatli sotib olganingizdan so'ng, siz elita treyderlarini kuzatib, nusxa savdosini ham boshlashingiz mumkin.
Bitgetda yangi listinglar
Yangi listinglar

Ko'proq sotib oling


Sky (SKY) ni qayerdan sotib olsam bo'ladi?
Bitget ilovasida kripto sotib oling
Kredit karta yoki bank o'tkazmasi orqali kripto sotib olish uchun bir necha daqiqada ro'yxatdan o'ting.
Video bo'limi — tezkor tekshiruv, tezkor savdo

Bitgetda shaxsni tasdqilashni qanday yakunlash va o'zingizni firibgarlikdan himoya qilish kerak
1. Bitget hisobingizga kiring.
2. Agar siz Bitgetda yangi bo'lsangiz, hisob yaratish bo'yicha o'quv qo'llanmamizni tomosha qiling.
3. Profilingiz belgisiga kursorni olib keling, "Tasdiqlanmagan" tugmasini bosing va "Tasdiqlash" tugmasini bosing.
4. Chiqaruvchi mamlakat yoki mintaqa va ID turini tanlang va ko'rsatmalarga amal qiling.
5. O'zingizning xohishingizga ko'ra "Mobil tekshiruv" yoki "Kompyuter" ni tanlang.
6. Ma'lumotlaringizni kiriting, shaxsingizni tasdiqlovchi hujjat nusxasini yuboring va selfi oling.
7. Arizangizni yuboring va bo'ldi, siz shaxsingizni tasdiqlashni tugatdingiz!
Kriptovalyutalarga sarmoya kiritish, jumladan Bitgetda onlayn Sky xarid qilish xavflarni o‘z ichiga oladi. Bitget Sky sotib olishning oson va qulay usullarini taklif etadi va birjada ko'rsatilgan kriptovalyuta haqida to'liq ma'lumot berishga harakat qiladi. Biroq, biz Sky xaridingizdan kelib chiqadigan natijalar uchun javobgar emasmiz. Taqdim etilgan barcha ma'lumotlar xarid uchun tavsiya etilmaydi.
SKY dan UZS ga konvertori
SKY
UZS
1 SKY = 1,004.18 UZS
Bitget barcha yirik savdo platformalari orasida eng past tranzaksiya to'lovlarini taklif qiladi. Sizning VIP darajangiz qanchalik yuqori bo'lsa, tariflar shunchalik qulay bo'ladi.
Qiymatni saqlashDeFiDAOEthereum ekotizimiPolychain Capital portfeliBoshqaruvQarz berish va qarz olishDragonFly Capital portfeliElectric Capital Portfolioa16z Portfeli1 Tasdiqlash portfeliPlaceholder Ventures portfeliPantera Capital portfeliParadigm portfeliNear Protocol ekotizimiArbitrum ekotizimiSpartan GroupBNB Chain EcosystemReal dunyo aktivlariStandard Crypto Portfolio
Sky reyting
Jamiyatning o'rtacha baholari
4.6
Ushbu kontent faqat ma'lumot olish uchun mo'ljallangan.
Bitget Insaytlari
sadiqmaimalari
19S
In the bull market, everyone’s a genius—until the music stops."
I learned this the hard way.
Back in the last bull run, I wasn’t some chart wizard or trading expert. I didn’t spend hours analyzing candles or predicting price patterns. My knowledge was basic: buy low, sell high. Simple, right?
But guess what? That simplicity made me more money than some of the so-called trading pros around me.
I had a colleague who was deep into technical analysis. He'd spend hours breaking down market structures, studying support and resistance, calculating Fibonacci levels. Meanwhile, I focused on strong projects with real-world utility. Once my RSI said "oversold," I bought. When it said "overbought," I sold.
And while he was waiting for the perfect entry, I was banking profits. In the bull market, momentum is king—and even basic strategies can win big. It felt like everyone was making money. Confidence was sky-high.
But then... the music stopped.
The bear market came without warning.
There were no signs saying, “It’s over now.” Tokens just started bleeding, influencers went silent, and portfolios shrank overnight.
That’s when reality hit:
Bull markets reward confidence.
Bear markets reward knowledge.
What saved me wasn’t luck—it was experience and the lessons I learned from previous cycles. The market doesn’t care how hyped you are. It cares how prepared you are.
So here’s my message to every crypto trader and investor riding this current wave:
Celebrate your wins, but don’t confuse a bull market with skill.
The real test is how you move when the market turns red.
Learn. Stay humble. Know when to buy—and more importantly, know when to sell.
Because when the bull runs out of breath, only the wise keep standing.
RED-0.54%
MOVE+9.88%

shidde
1K
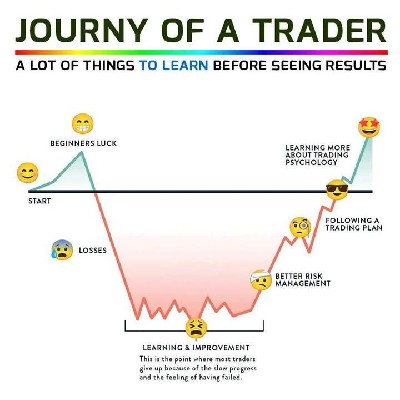
When it comes to TRADING Indicators in the Market, how it is different from how some people see it, or understand it!...
How to use indicators to identify entry or exit from the market is good.
Any Indicator that exists is used to look at the market before using it to find an Entry or Exit:
Let's take an example of Bollinger band (BB):
BOLLINGER is a Lagging indicator, which tells us about something in the market as soon as it happens.
For example, once a Breakout of a support or resistance in the market is made. When we see that the Upper Band of this BB is broken, it will confirm to us that a successful Breakout was not made (Although it can also be a Fakeout) But it is difficult, not like in Price action.
When we talk about "Lagging indicator", then we say that BB is one of these categories of Lagging indicator.
I mean that it is an Indicator that tells us about something as soon as it happens, as I gave the example above.
To better understand Lagging indicators, let's take an example of what actually happens, which is an indicator.
For example: if you see smoke rising from the sky, you see this shows you that a fire has started in the area where the smoke is rising, you see there is no way to see smoke above the sky without a fire, if we see smoke rising, it must be an indicator that tells us that a fire has started. (This is called Lagging).
But in the RSI example that I gave (in the article I wrote earlier) and gave an example of Danger, if we look at it, we will see that a danger can appear without rain falling. You see, it announces something before it happens (meaning it is a Leading indicator).
Hope you understand this!?
Let's continue...
It is not possible to say that you can always trade with just one indicator!!!
Why?
Because the market is always changing, From "UP-TREND," to "Consolidation", to "DOWN TREND,"...
The market may know that it is in an Up-trend for a long time, But keep in mind, one day the market must turn.
Now for an example:
Let's take BOLLINGER BAND (BB), this indicator is traded when the market is CONSOLIDATING/RANGING.
It has 3 parts:
1. Upper BAND.
2. Middle BAND.
3. Lower BAND.
How you trade it is: you wait for the price to come to the Lower BAND, then you buy. When it goes back to the Upper BAND Middle BAND, then you sell, and exit the market.
So you see, if the market is rising and you activate BOLLINGER BAND, it will be as if you are: TRADING AGAINST THE TRADE (meaning the market is falling and you are making a purchase decision). Since it works when the market is Consolidating.
See if the market is rising, There is one indicator you should use, For example let's take Moving average(SMA/EMA). Or MACD(Moving average convergence divergences).
See Moving average can be used to understand the duration of this trend:
1. LONG TERM BULLISH/BEARISH TREND.
2. MEDIUM TERM BULLISH/BEARISH TREND.
3. SHORT TERM BULLISH/BEARISH TREND.
And you can also use it (moving average) As support or resistance. And so on.
Also, MACD is also used when the market is Up-trend, Because it is a Lagging indicator, it tells us when something happens.
In the MACD section we can look at DIVERGENCE, Although RSI is the best indicator I use to understand DIVERGENCE.
And we can also trade HISTOGRAM, or ZERO CROSSES. All this under MACD.
Sometimes we use these indicators just to get more confirmation on this drawing you made in price Action. Make sure you are not wrong, Because Investors can manipulate Price, But if you use Indicator. It is very difficult to manipulate you.
My advice to you is, understand your Trading system, then take indicators that are suitable for this system, and always Trade with them.
Don't say that you will activate any indicator, because that will ruin your entire system.
That will help you a lot in Making faster decisions, which will make your trading process much more efficient.
May Allah grant us success in what we set out to do!!
Thanks
FIRE-6.53%
UP-0.46%
Mr,crypto2020
3K
Bitcoin 97,000$ 🙌 📊 What next
a little pull back then sky rocket 🚀
BITCOIN-3.71%
SKY-0.42%

Bitcoin_for_Freedom
4K
The Bitcoin hash rate is sky rocketing, the M2 money supply is soaring, New Hampshire signed a BTC bill, BTC on exchanges fell by 90k the last month, ETFs are buying 5k BTC per day, Strategy and Twenty One are competing for the most BTC. Everything is set for the bull run!🚀
BTC-0.56%
SKY-0.42%

AhmedAlgoTrader
4K
Spark Commits Additional $1 Billion to Lead Tokenized Treasuries Sector
Spark has allocated another $1 billion to tokenized U.S. Treasuries, bringing its total deployment to $2.4 billion across three funds.

By Vismaya V
May 6, 2025
3 min read

A spark. Image: Shutterstock
In brief
Spark, part of the Sky (formerly MakerDAO) ecosystem, has allocated another $1B to tokenized U.S. Treasury-backed RWAs, raising its total TVL to $2.4B.
The new funds go to BlackRock/Securitize’s BUIDL, Superstate’s USTB, and Centrifuge-Anemoy’s JTRSY—the same recipients from Spark’s Tokenization Grand Prix.
Spark now controls over two-thirds of the $3.5B tokenized U.S. Treasuries market, solidifying its lead in on-chain RWA deployment.
S-0.87%
SKY-0.42%
Shunga o'xshash aktivlar
Mashhur kriptovalyutalar
Bozor kapitali bo'yicha eng yaxshi 8 kriptovalyuta tanlovi.


Yaqinda qo’shildi
Eng so’nggi qo’shilgan kriptovalyutalar.


Sky haqida qo'shimcha ma'lumot
Tanga haqida umumiy
Tanga bilan bog'liq
Savdo bilan bog'liq
Tangalar yangilanishi
Boshqa mahsulotlar
Savdo
Earn
SKY Bitget Birjasi da savdo qilish mumkin va Bitget Wallet da himoyada saqlanishi mumkin. Bitget Birjasi ham SKY savdolarini qo’llab-quvvatlaydigan birinchi CEX platformalaridan biridir.
Bitgetda SKY savdosini amalga oshirishingiz mumkin.SKY/USDT
Spot