Official Trump (TRUMP) To Make Rebound? Potential Harmonic Pattern Signaling an Upside Move

Date: Tue, April 22, 2025 | 08:16 AM GMT
The cryptocurrency market has been under intense selling pressure recently, with Ethereum (ETH) posting its worst Q1 since 2018, sliding more than 45%. That bearish wave swept across the altcoins and memecoins — and the Official Trump (TRUMP) token wasn’t spared either.
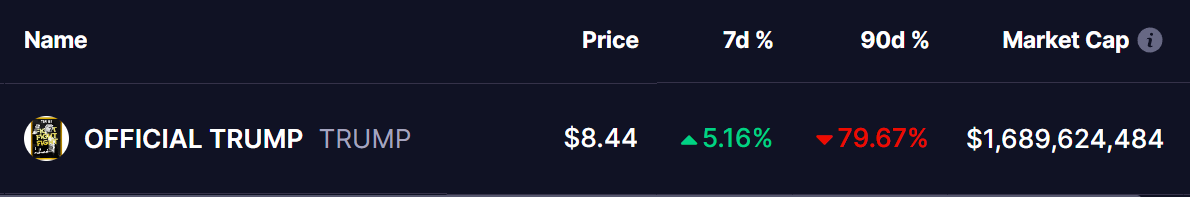
But there’s a shift in momentum brewing. TRUMP has managed to get back on the green track in weekly gains, narrowing its 90-day crash to around 79%. And interestingly, it could be gearing up for a strong rebound, according to a developing harmonic pattern spotted on the daily chart.
 Source: Coinmarketcap
Potential Harmonic Pattern Signals Upside Move
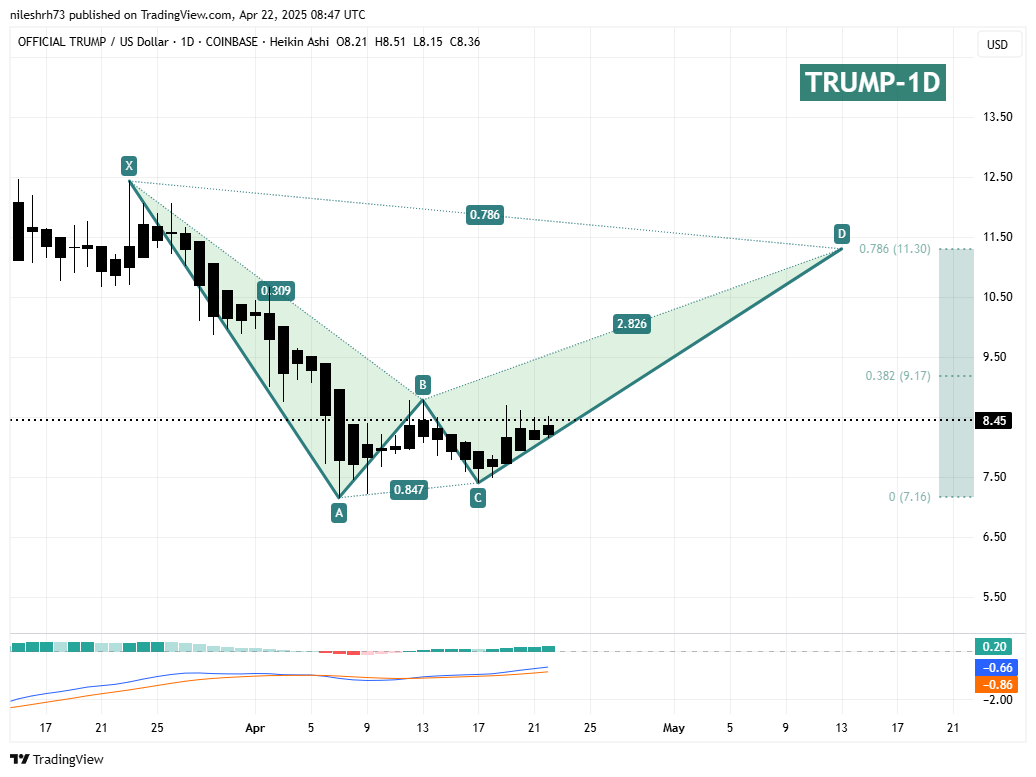
On the daily chart, a potential Bearish Gartley structure is forming. While the Gartley pattern traditionally warns of a reversal once completed, it also leaves room for a solid upside move before reaching that critical point.
TRUMP’s sharp decline started around March 23, after it failed to hold above the $12.43 resistance (marked as point X). Since then, TRUMP shed nearly 42% of its value, bottoming out near $7.15 on April 7 (point A). The AB leg retraced just 30.9%, a bit shallower than the typical 38.2%–61.8% Fibonacci range — but the overall harmonic setup remains strong and valid.
 Polygon (POL) Daily Chart/Coinsprobe (Source: Tradingview)
Following the BC leg, momentum clearly shifted. TRUMP bounced from around $7.40 (point C) and is now working through the CD leg of the pattern, moving higher with growing strength.
If the pattern continues to play out, TRUMP could rally toward the final target at point D, located near $11.30 — a move that would represent roughly a 33% upside from the current price near $8.45.
What’s Next for TRUMP?
If bullish momentum holds, TRUMP could climb toward the $11.30 zone in the coming days. This area not only completes the Gartley harmonic structure but also aligns with the 78.6% Fibonacci retracement of the X-C move — making it a major technical resistance to watch closely.
However, caution is advised. In harmonic trading, once the D point is hit, a reversal or heavy profit-taking is often expected.
Disclaimer: This article is for informational purposes only and does not constitute financial advice. Always do your own research before making any investment decisions.
Disclaimer: The content of this article solely reflects the author's opinion and does not represent the platform in any capacity. This article is not intended to serve as a reference for making investment decisions.
You may also like
BlockDAG Drops Price Pre-Reveal as Fartcoin Gains Traction

XRP Price Target Debated; SHIB Burns and Unstaked Gains

TRON Surpasses Resistance, Unstaked Promises High ROI

Gora Network Expands DeFi Integrations and DAO Governance
