Bitcoin (BTC) to Rise Further? Key Harmonic Pattern Signaling a Move Over $100K

Date: Wed, April 23, 2025 | 08:30 AM GMT
After a challenging start to 2025, the cryptocurrency market appears to be regaining momentum. Bitcoin (BTC) has surged by 12% in the past week, while Ethereum (ETH) gained 13%, signaling a potential shift in sentiment across the major altcoins .
Today, Bitcoin pierced above the $94,000 mark with a strong 6% rally. Even more compelling, a classic harmonic pattern forming on the daily chart suggests this move might just be getting started.
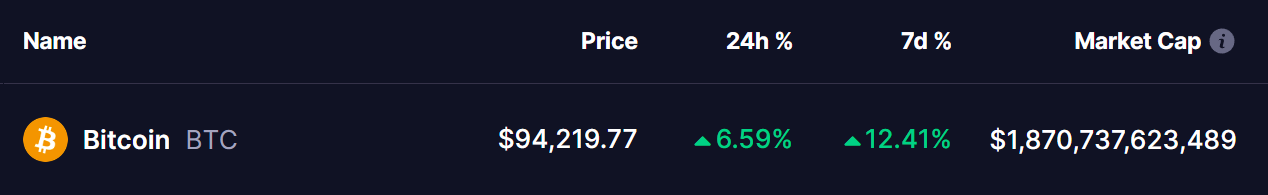 Source: Coinmarketcap
Harmonic Pattern Signals More Upside Move
The daily chart for BTC, viewed through the lens of Heikin Ashi candles, shows the emergence of a Bearish Cypher pattern — a harmonic formation that often signals a bullish continuation up to a key reversal zone.
The structure initiates at point X, marked by a rejection from Bitcoin’s all-time high of $109,557 on January 20. This led to a sharp decline to point A, followed by a recovery rally to point B, and then a deep correction to point C, which bottomed around $74,522 on April 7.
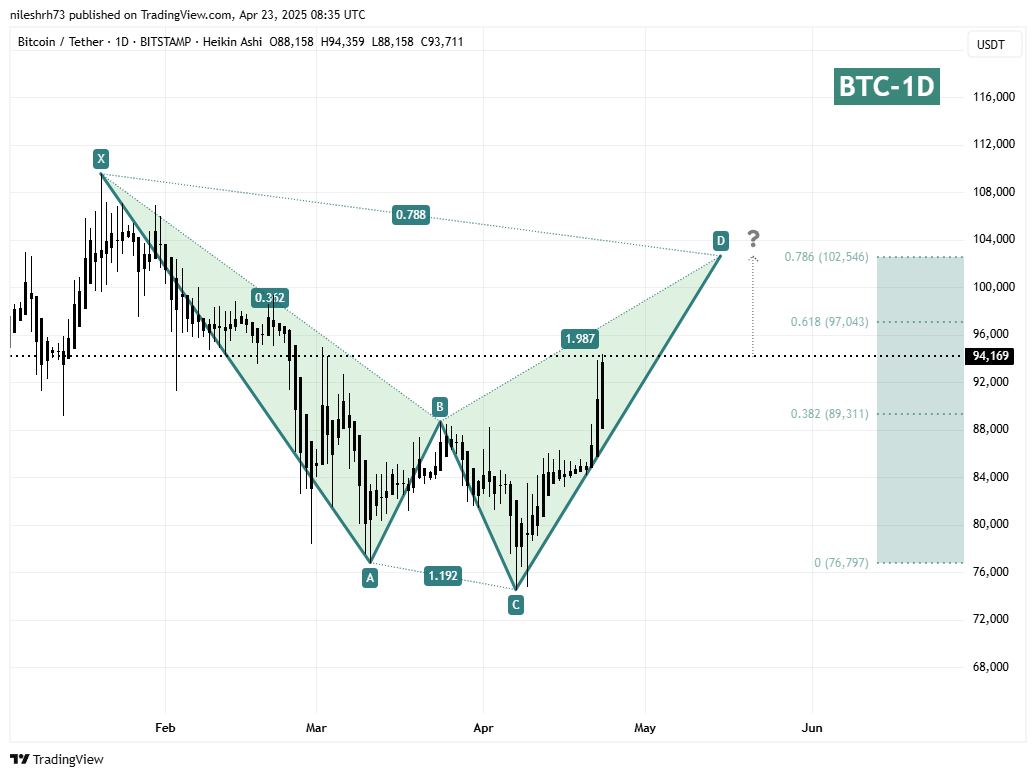 Bitcoin (BTC) Daily Chart/Coinsprobe (Source: Tradingview)
Although point C does not fully reach the ideal Fibonacci extension of 1.27–1.41, it still sits within an acceptable deviation, allowing the overall Cypher structure to remain valid.
Currently, Bitcoin is in the midst of forming the CD leg — the final phase of this harmonic setup — with strong price action propelling it higher.
If the pattern plays out as expected, the next major target is point D, which aligns with the 78.6% Fibonacci retracement of the X to C move — located around $102,546. From current levels (~$94,169), this suggests a potential upside of around 9%.
What’s Next for BTC?
A rise toward the $102K level would mark the completion of the Cypher pattern and bring BTC into a critical resistance zone — a region that could potentially attract profit-taking or even catalyze a short-term reversal.
Before reaching that milestone, however, Bitcoin must first clear intermediate resistance around $97,043, which corresponds to the 61.8% Fibonacci retracement. A strong breakout above this level could pave the way for a faster ascent toward the final target.
From a technical standpoint, the overall bullish structure remains intact. Momentum indicators such as MACD and RSI (not shown in this chart) have also been turning positive, supporting the thesis of a continued upward push — at least in the short term.
Disclaimer: This article is for informational purposes only and not financial advice. Always conduct your own research before investing in cryptocurrencies.
Disclaimer: The content of this article solely reflects the author's opinion and does not represent the platform in any capacity. This article is not intended to serve as a reference for making investment decisions.
You may also like
Shiba Inu (SHIB) Drops 10%, But Bullish Divergence Signals Possible Rebound
Shiba Inu (SHIB) shows early signs of a rebound despite a recent 10% drop, with key indicators like Chaikin Money Flow and futures sentiment pointing to a potential recovery.

Market Shrugs Off Trump Tariffs With $2 Billion Crypto Inflows
Crypto markets are defying macroeconomic headwinds, with inflows reaching $2 billion last week. Bitcoin dominates as optimism grows post-election, even as tariffs and inflation stir caution.

TRON Sets New USDT Record as It Closes In on Ethereum’s Lead
TRON’s USDT supply reached an all-time high of $71 billion, bolstered by millions of loyal TRX holders. Yet, its dependence on stablecoins raises concerns about limited ecosystem diversity.

SEC’s May 5 Litecoin ETF Deadline Looms as Approval Odds Reach 79%
The SEC's decision on the proposed spot Litecoin ETF is drawing increased attention, with approval odds rising to 79% on Polymarket ahead of the May 5, 2025 deadline.