Bitcoin Faces More Downside as Miners Join the BTC Selloff

Bitcoin is under significant downside pressure as miners increase coin sales, contributing to a bearish outlook. BTC could dip to $74,000 if selling continues unless market sentiment improves.
As leading coin Bitcoin weathers one of its most bearish weeks since the start of the year, on-chain data suggests that miners have contributed significantly to the growing sell-side pressure.
On-chain data reveals that miners on the Bitcoin network have ramped up their coin-selling activity, a trend that could exacerbate the downward pressure on the coin’s price.
Bitcoin Bears Take Control as Miner Reserve Dips
According to CryptoQuant’s data, the BTC miner reserve has steadily decreased this week. As of this writing, it stands at 1.80 million BTC, down 1% from the previous week.
The BTC’s miner reserve tracks the number of coins held in miners’ wallets. It represents the coin reserves miners have yet to sell.
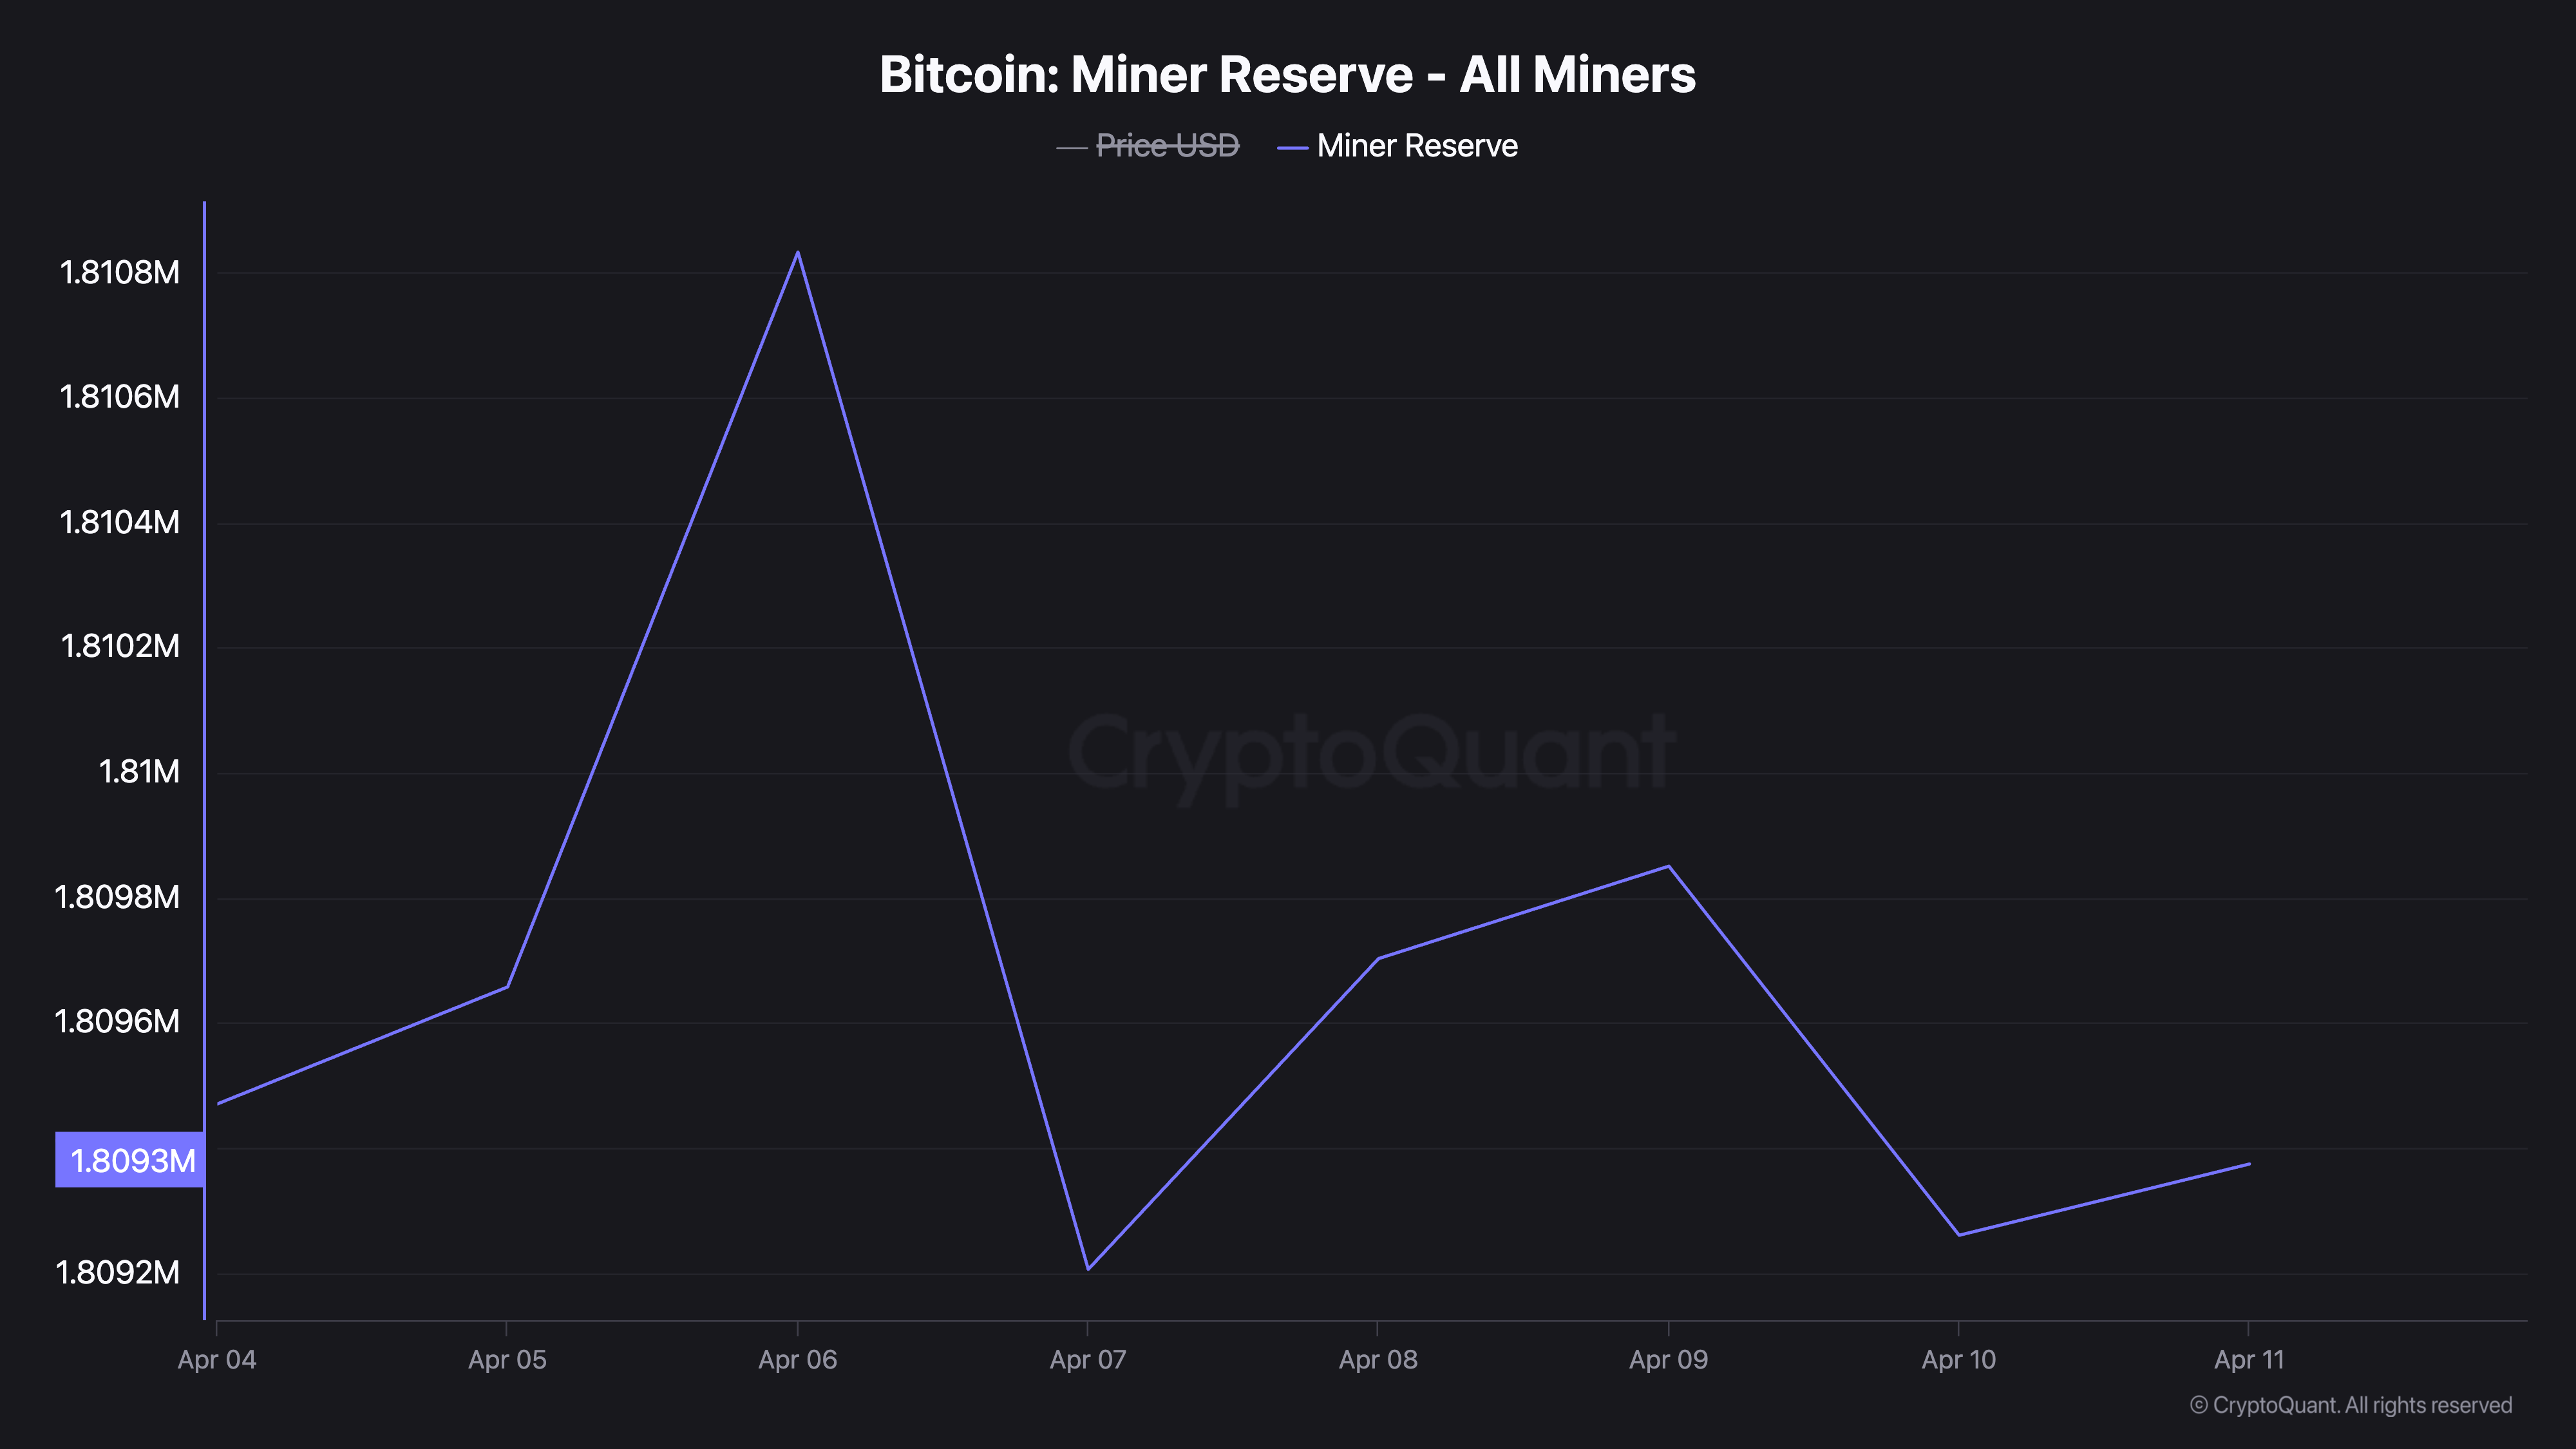 Bitcoin Miner Reserve. Source:
CryptoQuant
Bitcoin Miner Reserve. Source:
CryptoQuant
When the metric climbs, miners are holding onto more of their mined coins, often signaling confidence in future price increases. Conversely, when the reserve declines like this, miners are moving coins out of their wallets, usually to sell, confirming growing bearish sentiment against BTC.
The coin’s negative miner netflow further confirms this trend. As of April 10, this was -590.40. BTC’s miner netflow tracks the difference between the amount of coins sent to exchanges versus what is withdrawn.
When its value is negative like this, more coins are being moved from miner wallets to exchanges, typically a precursor to selling.
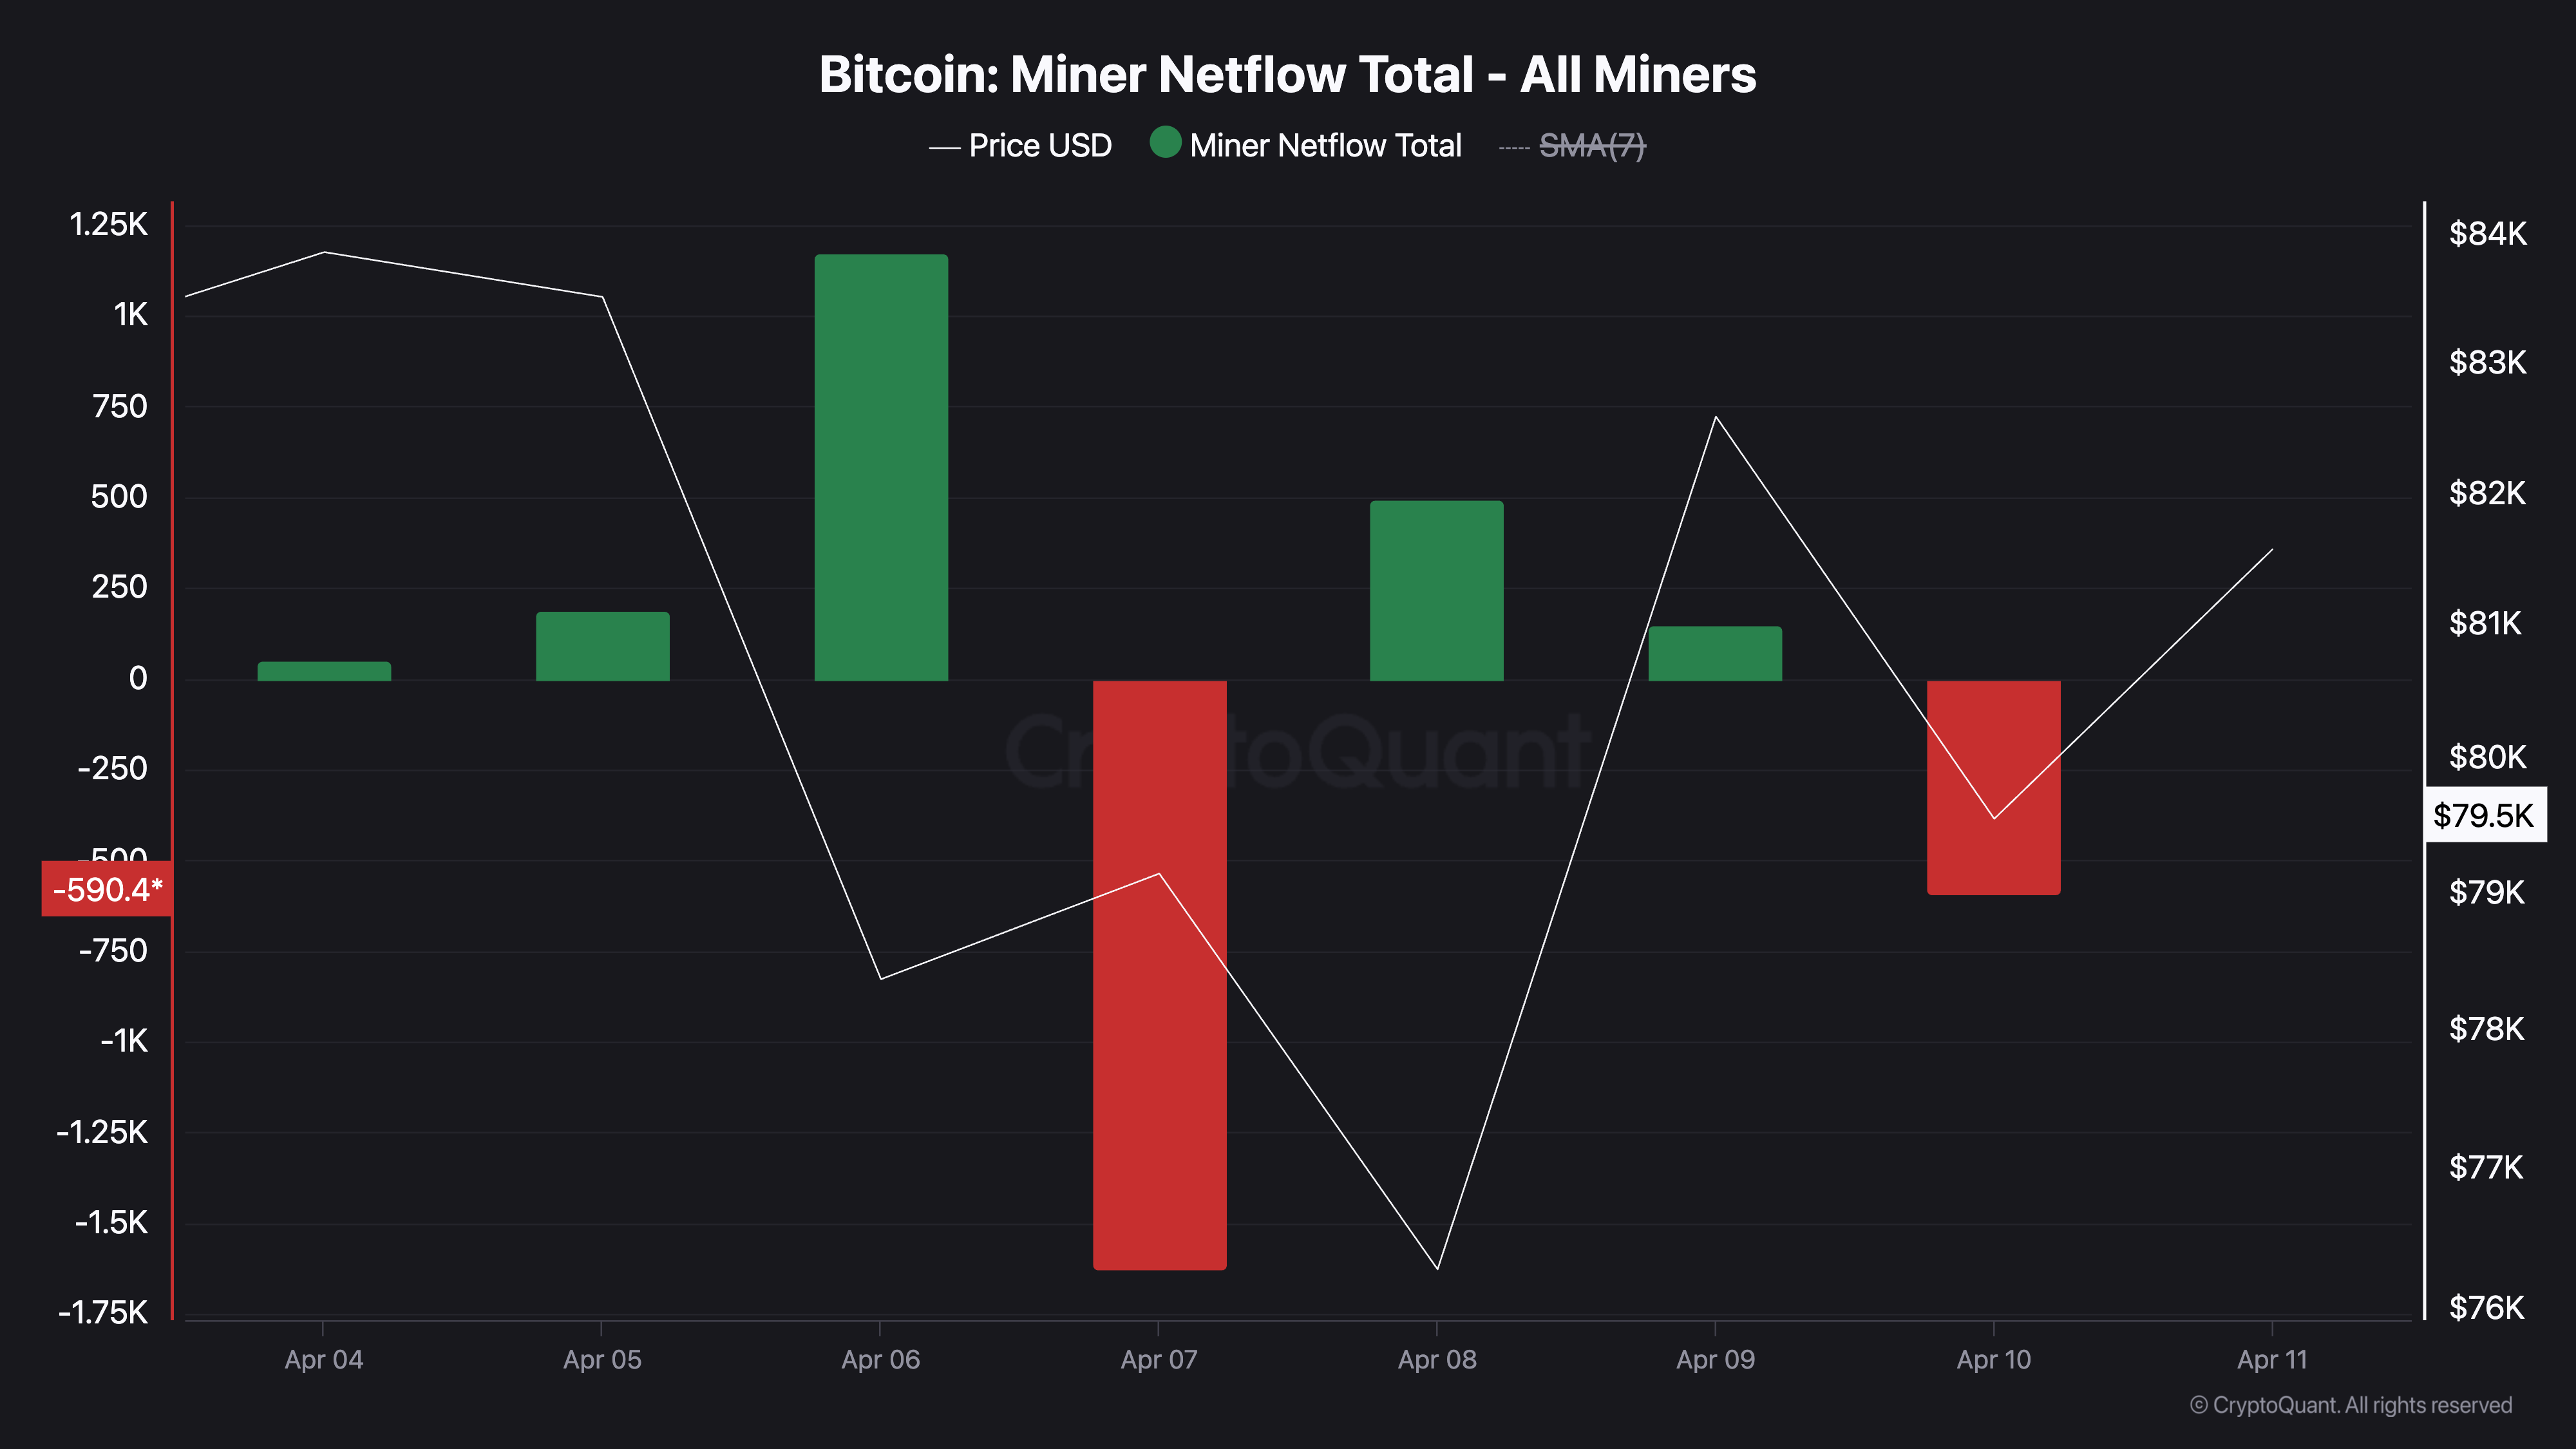 Bitcoin Miner Netflow. Source:
CryptoQuant
Bitcoin Miner Netflow. Source:
CryptoQuant
With added downward pressure from this segment of BTC holders, the coin’s price could see deeper corrections in the short term if buying interest fails to counterbalance the ongoing liquidation.
Bitcoin’s Bearish Trend Could See Price Fall to $74,000
On the daily chart, BTC remains significantly below its Super Trend indicator, which forms dynamic resistance above its price at $90,911.
This indicator tracks the direction and strength of an asset’s price trend. It is displayed as a line on the price chart, changing color to signify the trend: green for an uptrend and red for a downtrend.
When an asset’s price trades below its Super Trend indicator, selling pressure dominates the market. This bearish trend could further prompt BTC holders to sell, worsening its price dip. If this happens, the coin’s price could fall below the key support at $80,776 to trade at $74,389.
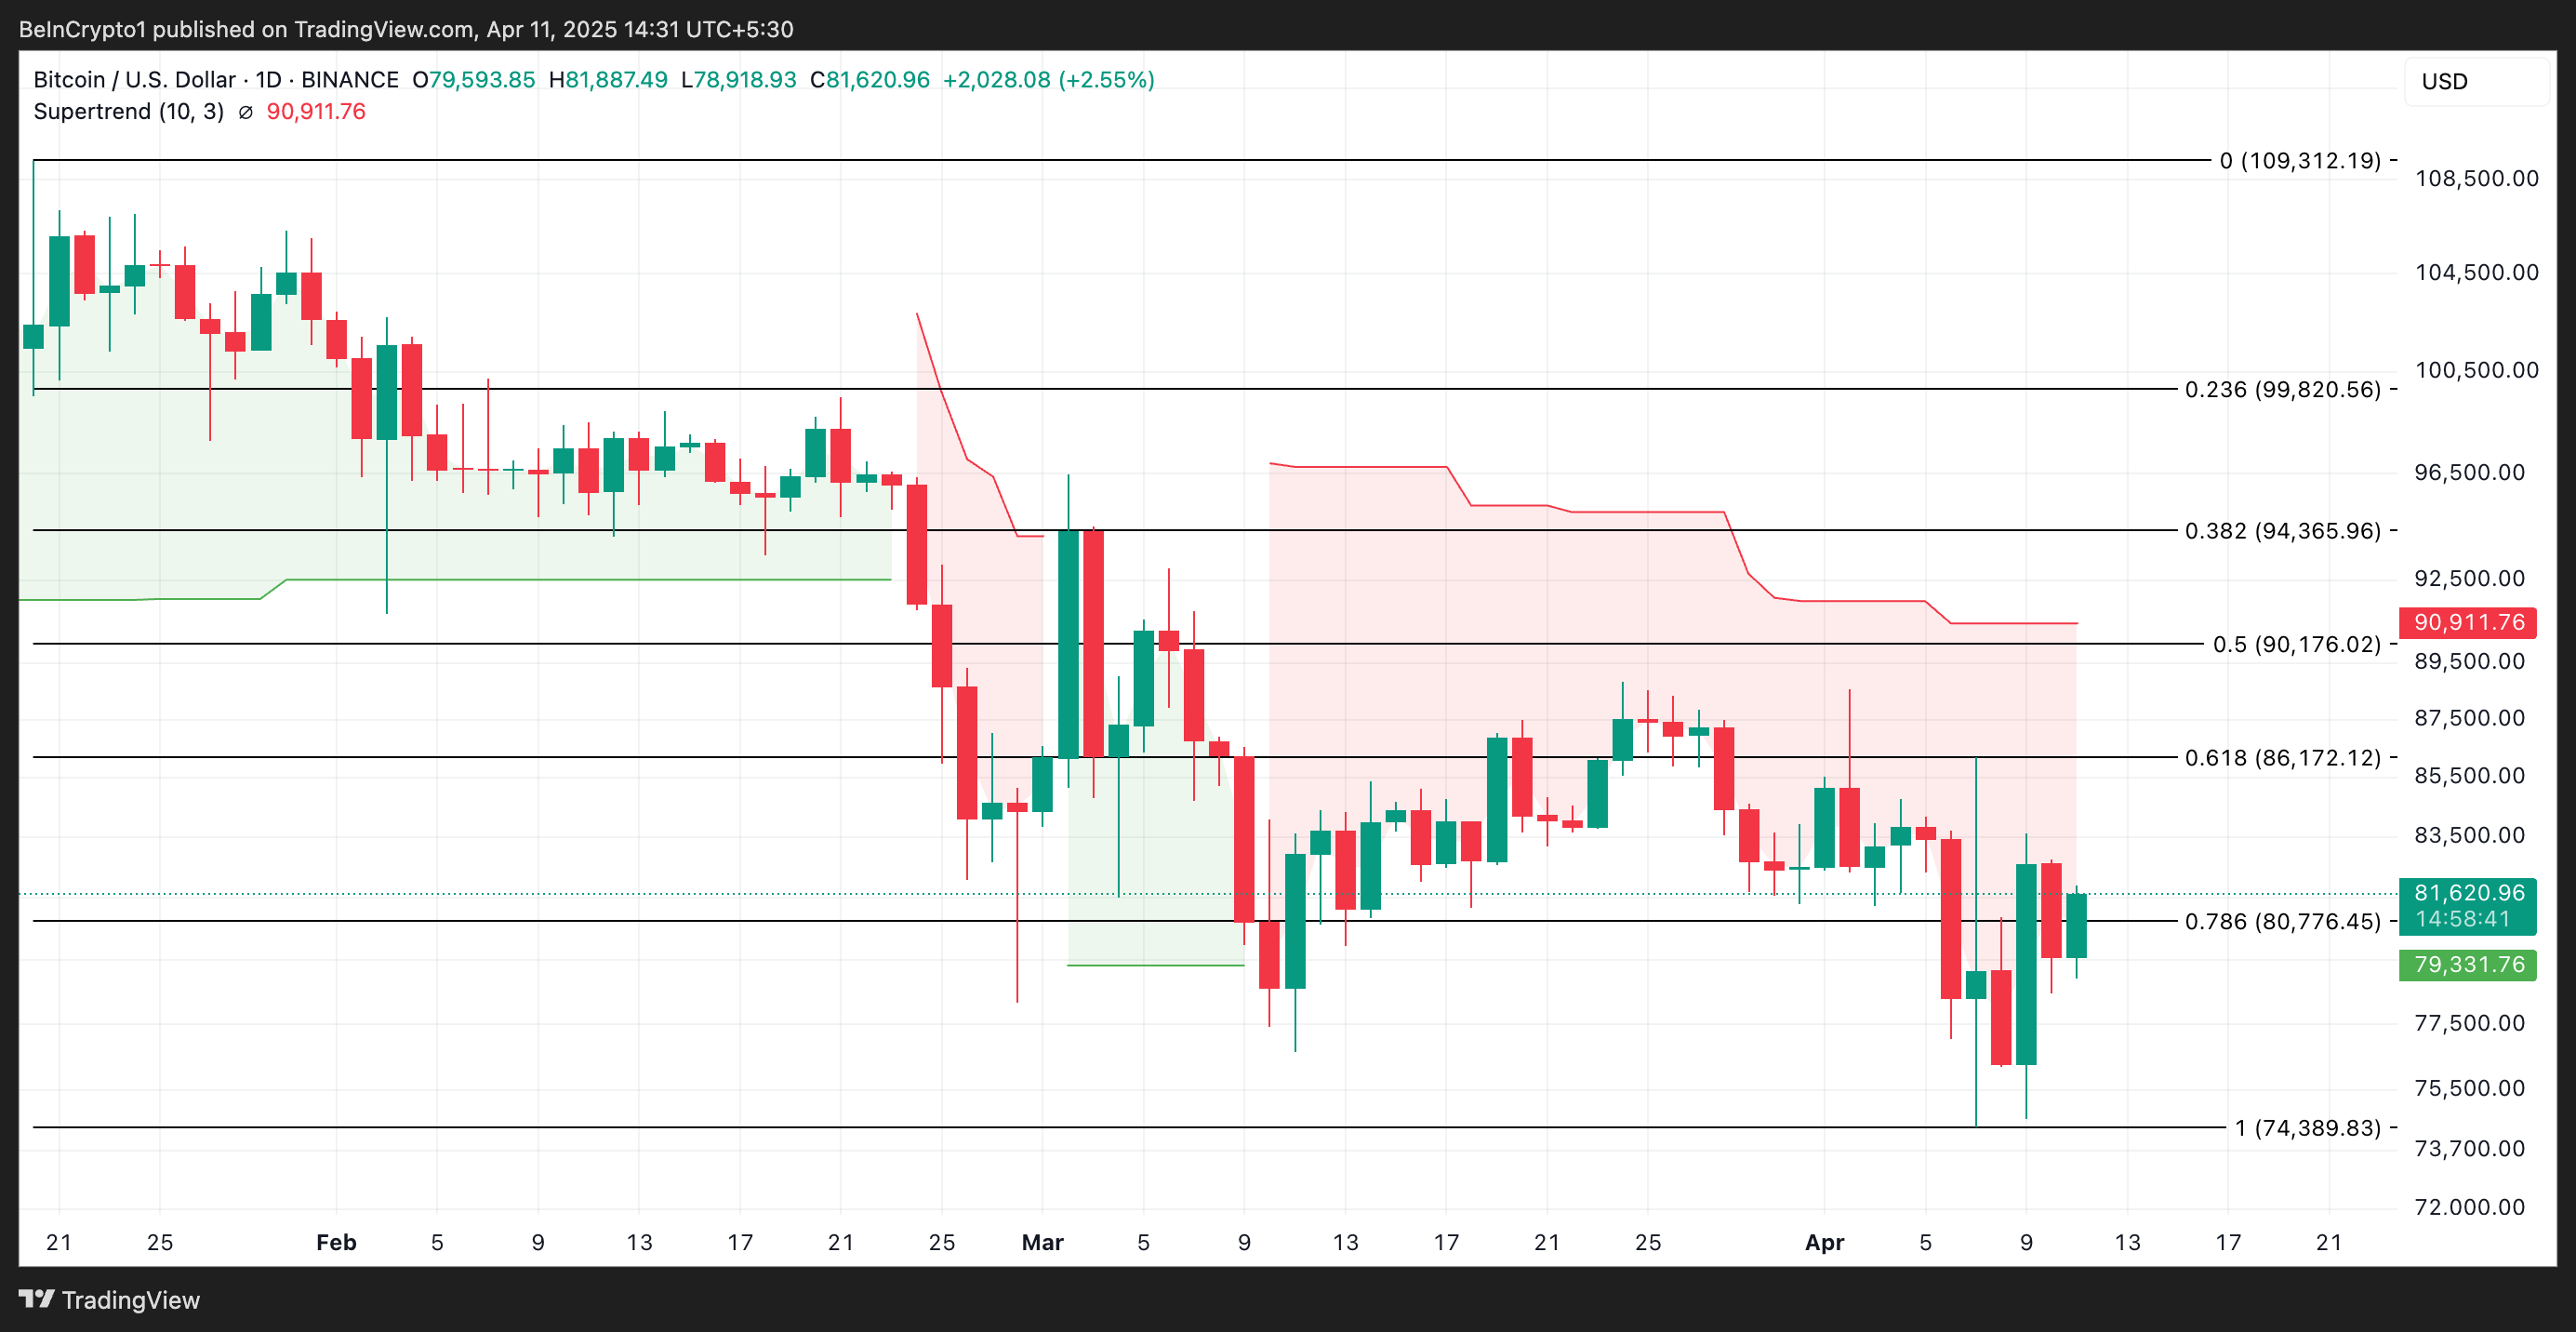 Bitcoin Price Analysis. Source:
TradingView
Bitcoin Price Analysis. Source:
TradingView
However, if market sentiment improves and coin holders reduce their selling activity, BTC could reverse its downtrend and rally to $86,172.
Disclaimer: The content of this article solely reflects the author's opinion and does not represent the platform in any capacity. This article is not intended to serve as a reference for making investment decisions.
You may also like
SUI Token Surges as Analysts Highlight Promising Patterns and Predictions
In Brief SUI token demonstrates strong performance with significant recent price increases. Technical patterns suggest potential bullish trends and buying opportunities. Analysts project ambitious targets, including a possible rise to $10 or more.

STX Token Surges as New Financial Opportunities Emerge in the Stacks Ecosystem
In Brief The STX token has surged by 56%, reaching a two-month high. BitGo introduced sBTC to enhance Bitcoin's usability in decentralized finance. Liquidity in the Stacks ecosystem is increasing, attracting more users and developers.

U.S. stocks opened, S&P 500 rose 0.1%
Uniswap Web App Adds LP Rewards Function