Osmosis Price Prediction 2025-35: Will It Hit $100 by 2035?


- On-chain features like MEV capture and stable swaps increase Osmosis (OSMO) utility.
- OSMO’s derivatives trading volume spiked 196.77%, signaling revived trader interest.
- Forecasts expect OSMO to trade between $0.10 and $7.00 during the 2025 bull run.
Osmosis (OSMO) Overview
| Cryptocurrency | Osmosis |
| Ticker | OSMO |
| Current Price | $0.2203 |
| Price Change (30D) | -9.28% |
| Price Change (1Y) | -82.65 |
| Market Cap | $158.83 Million |
| Circulating Supply | 720.71 Million |
| All-Time High | $11.21 |
| All-Time Low | $0.1972 |
| Total Supply | 997.28 Million |
What is Osmosis (OSMO)?
Osmosis (OSMO) is the decentralized exchange at the center of the Cosmos ecosystem, designed to connect multiple blockchains through seamless, trustless asset swaps. As the primary liquidity and trading hub for the Inter-Blockchain Communication (IBC) protocol, Osmosis allows users to interact with over 50 Layer-1 chains—and that number continues to grow.
 Source:
Osmosis
Source:
Osmosis
From Cosmos-native tokens to assets on Ethereum, Solana, Polkadot, and even Bitcoin, Osmosis enables asset transfers and liquidity access across chains without intermediaries.
Osmosis Key Features
What sets Osmosis apart is its flexibility. Unlike traditional AMMs, such as Uniswap, which restrict pool settings, Osmosis allows users to customize key parameters such as swap fees, bonding curves, and token ratios. This dynamic structure supports more efficient pricing and empowers liquidity providers to adapt to market conditions.
Developers can also create pools optimized for complex financial instruments, including options, NFTs, and synthetic assets—all with minimal overhead. Beyond the exchange, Osmosis hosts a suite of applications through the Osmosis Zone Apps.
These apps integrate directly with the AMM engine, including advanced features like stable swaps, concentrated liquidity, and in-protocol MEV capture. As a result, Osmosis delivers the user-friendly experience of a centralized platform while retaining the core benefits of decentralization: custody, privacy, and transparency.
How Osmosis Works
The platform facilitates trades using an Automated Market Maker (AMM) model. Users simply select their token pair, input the amount, and execute the swap—all on-chain, without custodians or third-party risks. Validators on the network accept fees in many tokens, which are automatically converted to OSMO and distributed to stakers.
Osmosis also features Superfluid Staking, allowing users to delegate LP tokens and secure the network while earning staking rewards. This boosts capital efficiency and network security.
OSMO Token Utility and Supply
The OSMO token serves several roles: governance, transaction fees, and network incentives. Holders propose and vote on upgrades, liquidity pool rewards, and more. A small taker fee (default 0.1%) is applied on every trade, with proceeds going to stakers. Additionally, the ProtoRev module captures arbitrage profits and burns recovered OSMO, reducing the total supply.
Tokenomics Overview
- Maximum Supply: 1 billion OSMO
- Total Supply: 997.28 million
- Circulating: ~720.71 million
Distribution
- Liquidity Mining: 40.5%
- Developer Vesting: 22.5%
- Staking: 22.5%
- Community Pool: 4.5%
- Strategic Reserves and Airdrops: 10%
With a unique “thirdening” release schedule, token issuance drops by one-third each year until the total cap is met.
Osmosis Price History
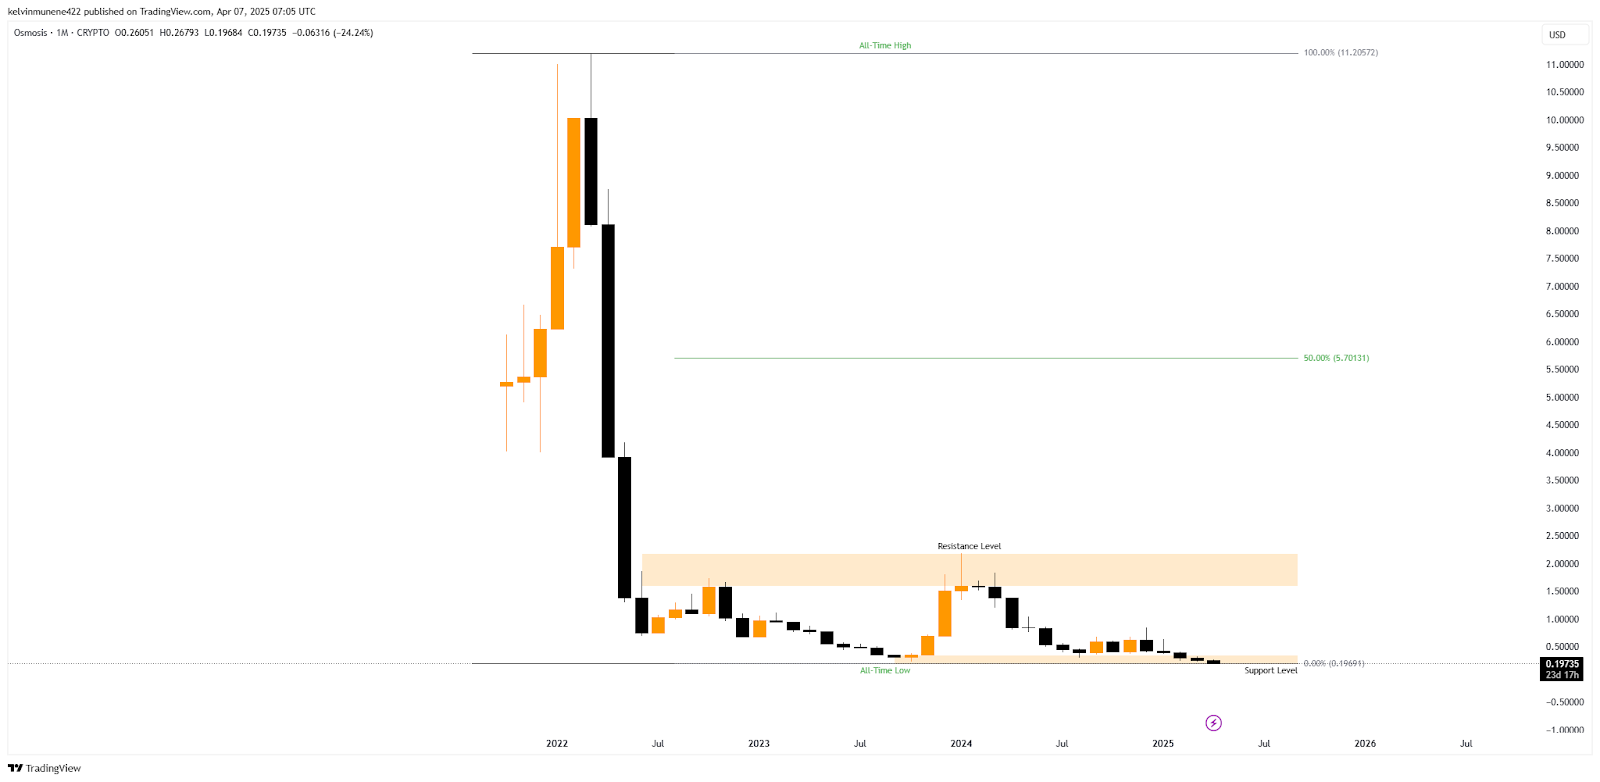
At launch, the OSMO token climbed sharply, recording a price surge of almost 179% from a low of $4.00240 to a peak of $11.21. The upward move halted at that level as selling pressure built up and prevented further rise. This point marked the token’s all-time high and triggered a steep decline.
As a result, the token’s price fell over 93%, settling near the $0.68780 mark, which offered temporary support and opened the way for a short-lived rebound. However, the bounce lost strength around the $2.18–$1.59 range. This area has remained a key barrier, repeatedly stopping upward movements.
 Source:
TradingView
Source:
TradingView
Historically, OSMO’s price has approached this zone more than once but has failed to push through. Meanwhile, support formed around the lower side’s $0.36–$0.19 band. From this zone, OSMO continued sliding, touching a new low of $0.1972. This drop marked a total decline of 98.22% from the top, pressing the token into levels not seen before.
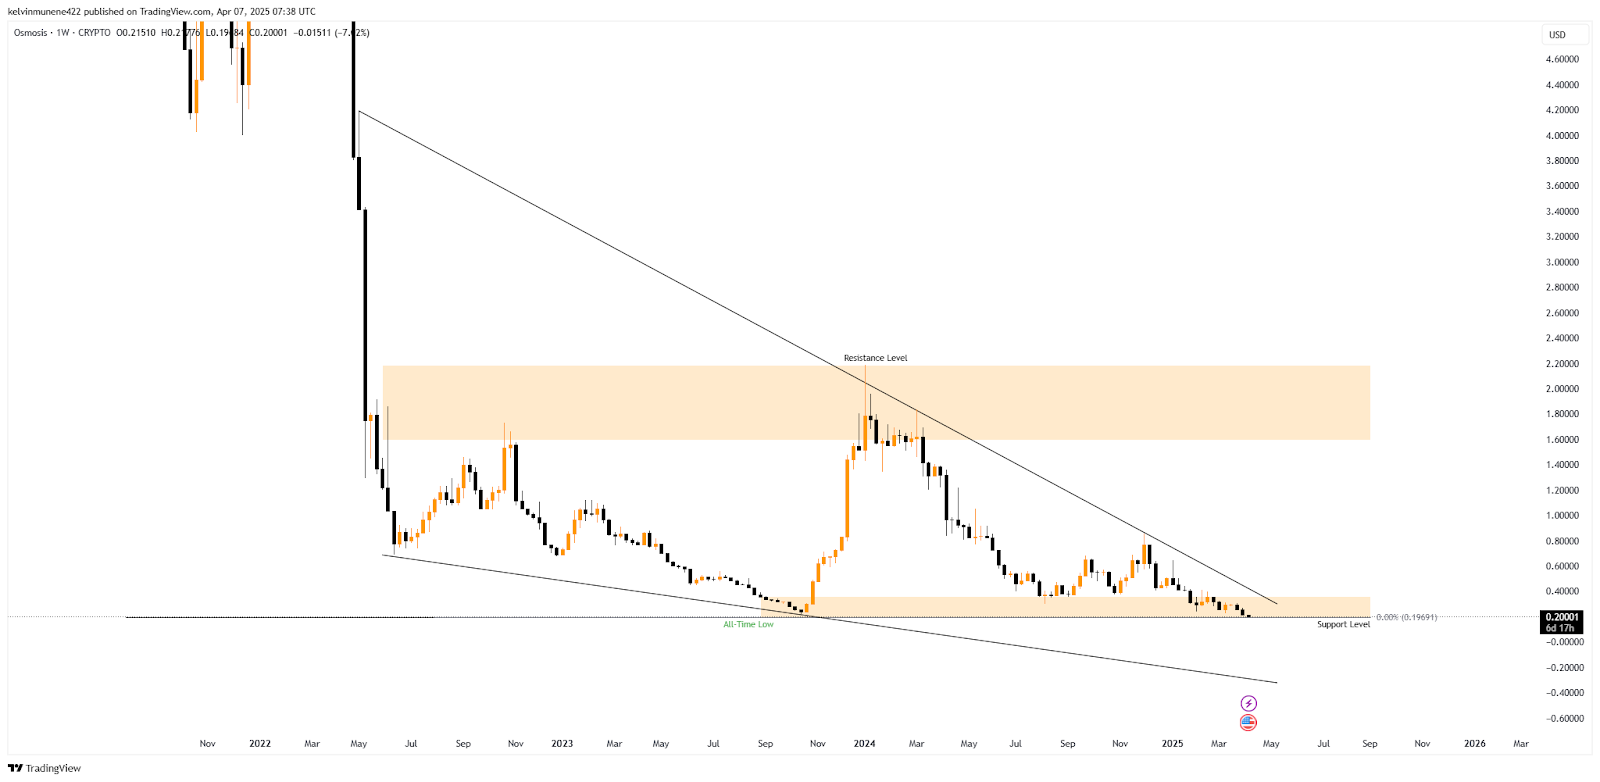
Zooming in on the weekly chart, the cryptocurrency’s price action has carved out a falling wedge—a formation where price tightens as both highs and lows drop over time. This structure often appears at the end of downward trends. The upper trendline of the wedge now acts as a ceiling.
 Source:
TradingView
Source:
TradingView
A weekly close above this line would signal a reversal and shift control back to buyers. In such a case, the $2.18–$1.59 area stands as the next key level to watch. Failure to reclaim ground above the wedge could bring more selling. A breakdown below the $0.36–$0.19 support range would expose OSMO to uncharted price levels.
OSMO Derivatives Market Shows Signs of Life
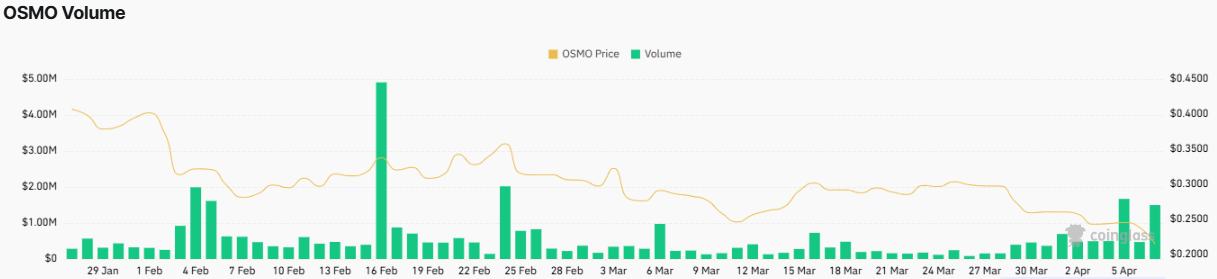
OSMO is showing renewed market activity, with data from Coinglass highlighting a sharp rise in derivatives trading. In the last 24 hours, volume jumped by 196.77%, hitting $1.67 million—a level last seen on February 24. This spike signals a growing interest in short-term price movements.
 Source:
Coinglass
Source:
Coinglass
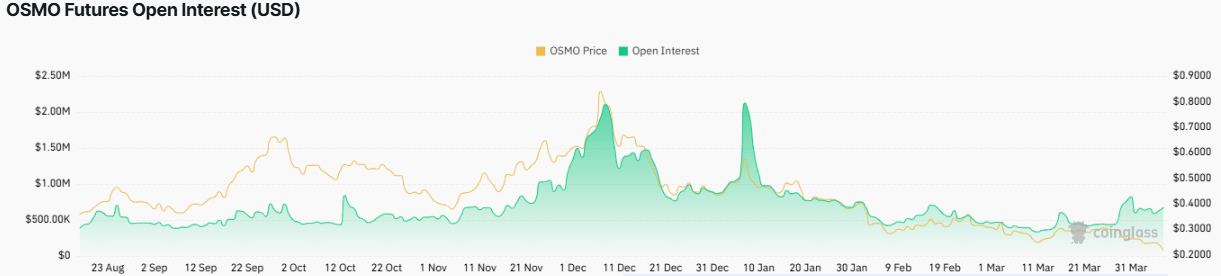
Open interest also shows signs of recovery. Although it remains well below the $2.12 million peak recorded on January 7, it has now climbed to $673.50K. The increase reflects a return of traders opening new positions after weeks of reduced activity.
 Source:
Coinglass
Source:
Coinglass
Open interest followed a clear downtrend from January to March, dropping as speculation cooled. Yet, the current rebound hints at renewed positioning, mainly as the token’s price consolidates near recent lows. Volume has followed a similar pattern—quiet through most of March, then suddenly active again in early April.
Together, these shifts in volume and open interest suggest traders are re-entering the market. With price movement still muted, this buildup could lead to sharper moves. For now, activity is rising steadily, and OSMO is regaining attention across future markets.
Related: EGLD Price Prediction 2025-35: Will It Hit $2,000 by 2035?
Yearly Highs and Lows of Osmosis
| Year | Osmosis Price | |
| High | Low | |
| 2025 | $0.64486 | $0.1972 |
| 2024 | $2.18614 | $0.30156 |
| 2023 | $1.80530 | $0.22403 |
| 2022 | $11.21 | $0.68280 |
| 2021 | $6.66343 | $4.00240 |
Osmosis Technical Analysis
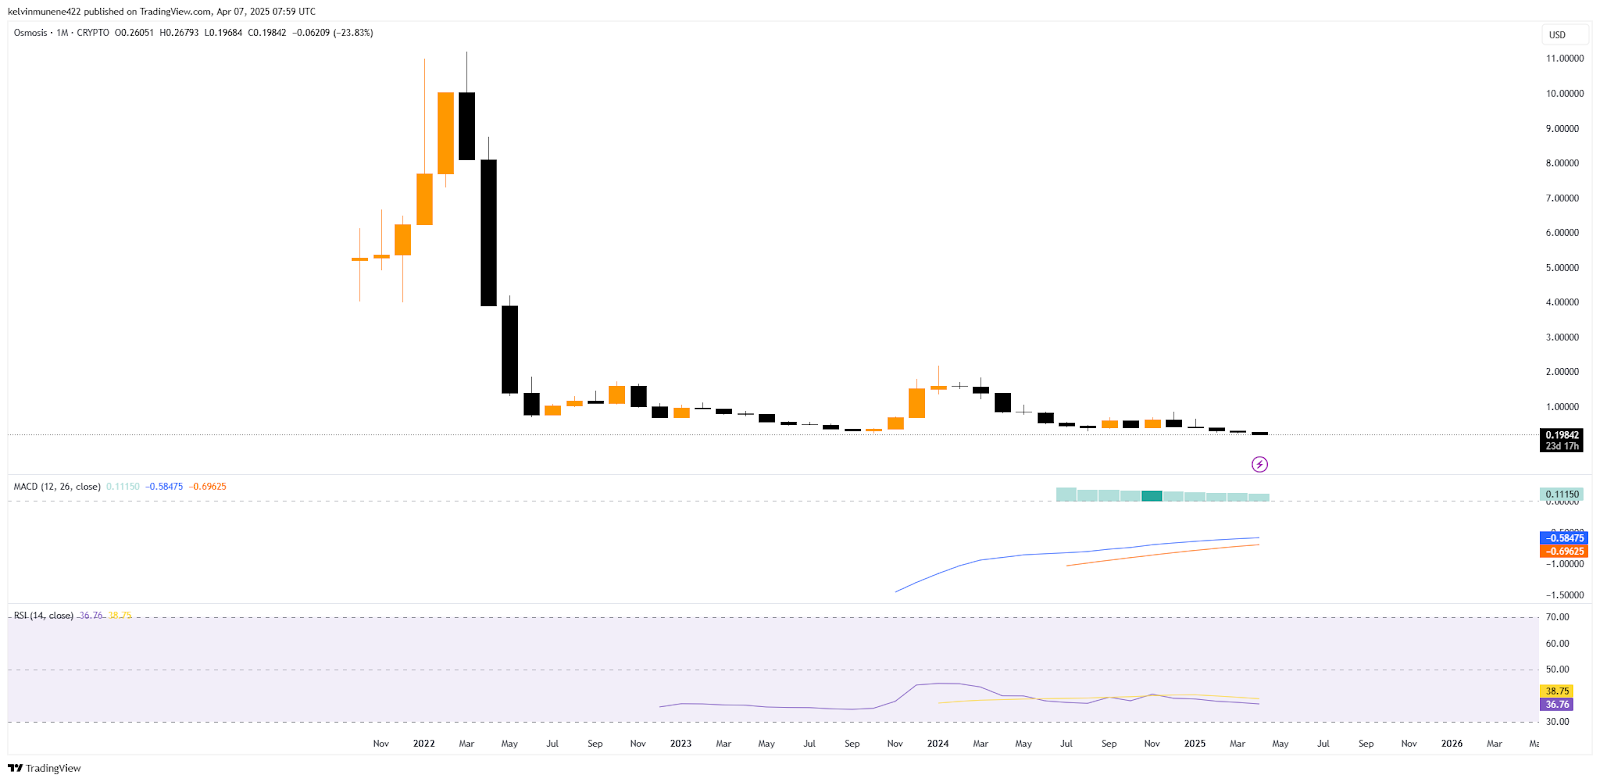
The MACD indicator on OSMO’s monthly chart shows fading bullish momentum, with histogram bars losing strength as they move closer to the zero line. Currently, the MACD line stands at -0.58475, while the signal line sits lower at -0.69625. The MACD line remains above the signal line, indicating a still-active bullish phase.
However, the narrowing gap and weakening histogram suggest this momentum is slowing down, pointing to a possible trend shift or price stagnation in the near term. Meanwhile, the RSI tells a different story.
 Source:
TradingView
Source:
TradingView
With a value of 36.76, it moves closer to the 30-level, often viewed as an oversold threshold. This places the RSI in a bearish territory, reflecting weak buying strength and rising selling pressure. The RSI has trended downward over the past few months, in line with OSMO’s prolonged price decline.
Osmosis (OSMO) Price Forecast Based on Fair Value Gap
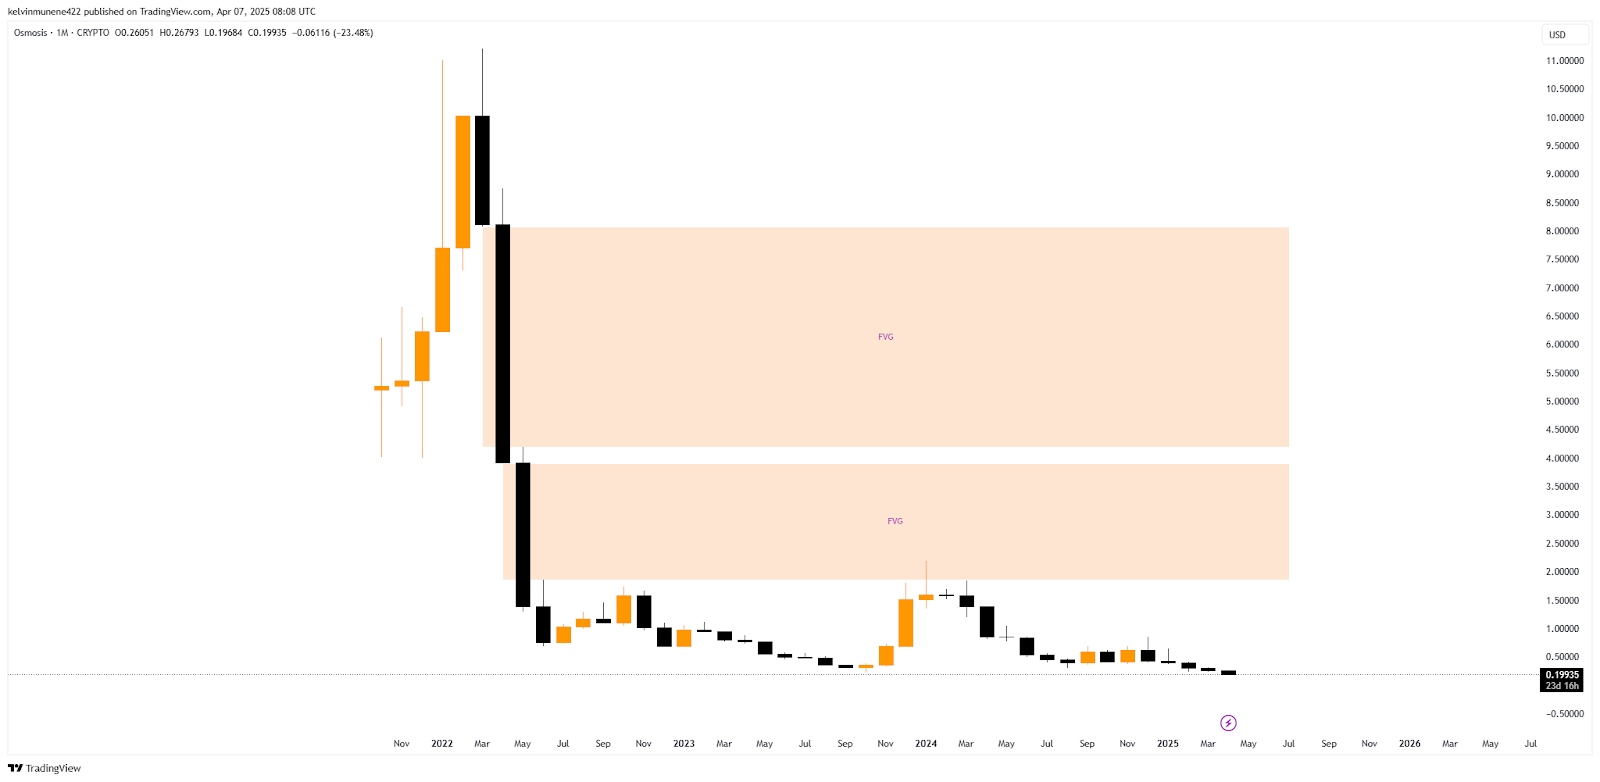
OSMO is trading below multiple Fair Value Gaps (FVGs) on the monthly chart, with price action showing signs of rejection at these levels. According to the chart, the token’s latest monthly price is around $0.19, well under the first FVG zone between $3.91 and $1.85.
This range was briefly tested in early 2024, but OSMO’s price failed to break through and sharply pulled back, confirming the gap as an active supply zone. Above this, a second FVG exists between $8.07 and $4.19, formed during the steep drop from early 2022.
 Source:
TradingView
Source:
TradingView
OSMO has not revisited this zone since, and it remains a key resistance area in any future recovery attempts. The fact that OSMO remains below both FVGs suggests firm bearish control and low momentum to reclaim lost ground.
These gaps act as magnet zones but also pose heavy resistance. Until the token’s price reclaims and closes above the lower FVG at $3.91-$1.85, upside moves may remain limited.
Osmosis (OSMO) Price Forecast Based on MA Ribbon Analysis
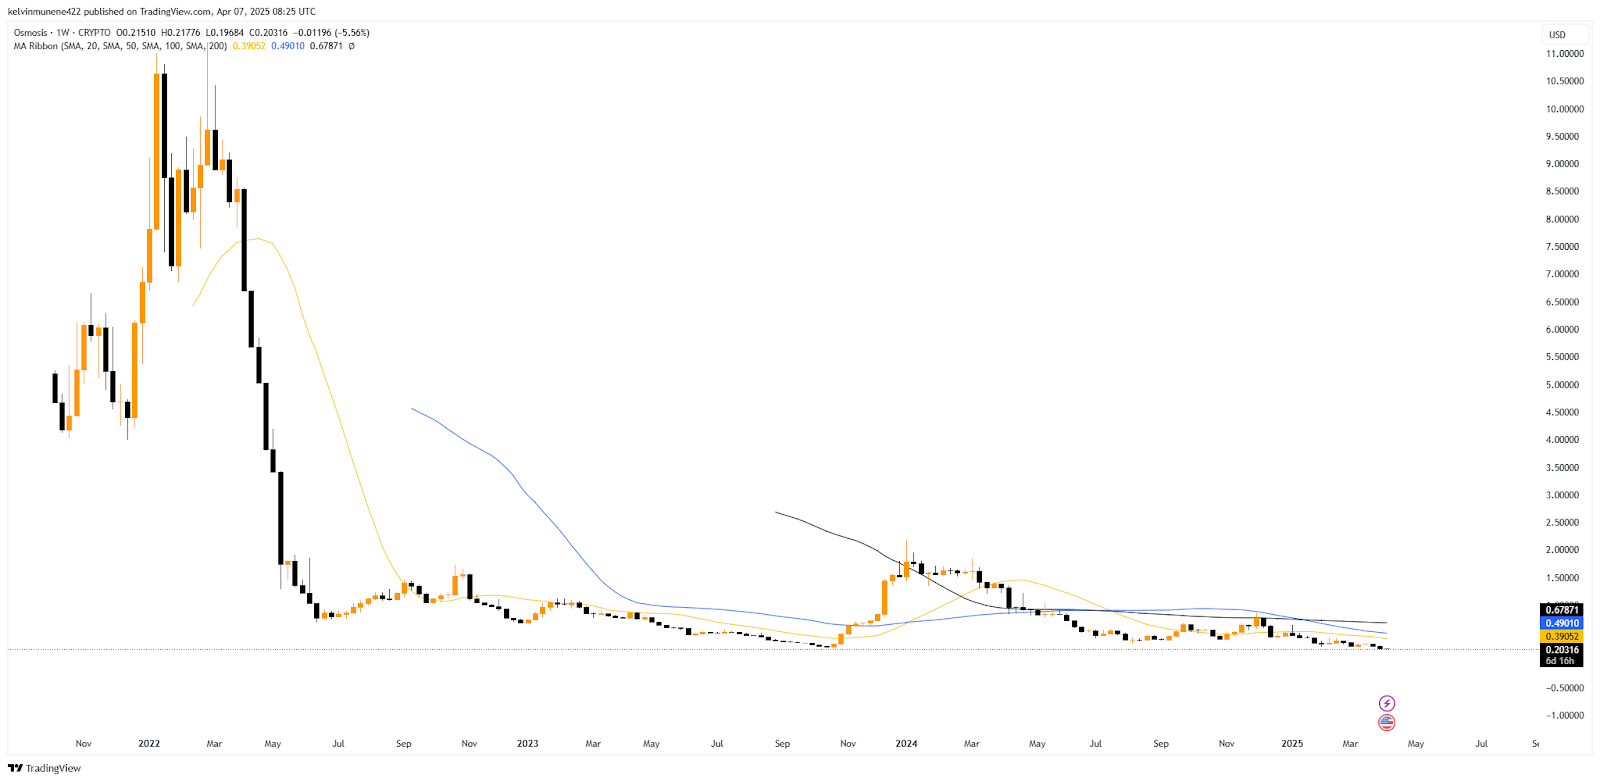
OSMO is trading below all major moving averages on the weekly chart, with the 100-week MA at $0.67871, the 50-week MA at $0.49010, and the 20-week MA at $0.39052. This alignment confirms a long—term bearish structure where the 100-week MA is on top, followed by the 50-week MA and then the 20-week MA.
At press time, OSMO trades at $0.20316, well below the entire MA ribbon, signaling persistent downside pressure and no clear reversal signal. The downward slope of each moving average suggests consistent selling over an extended period.
 Source:
TradingView
Source:
TradingView
After briefly testing the 20-week MA in early 2025, the price failed to sustain momentum and reversed sharply. Since then, all recovery attempts have stayed capped beneath the 20-week average, reinforcing it as a dynamic resistance.
Historically, the crossing of MAs in this sequence reflects a strong downtrend, with bulls unable to reclaim control. This trend has held since mid-2024 and remains in place. The bearish outlook stays intact unless OSMO’s price begins closing above the 20-week MA and sustains movement beyond the 50-week and 100-week averages.
Osmosis (OSMO) Price Forecast Based on Fib Analysis
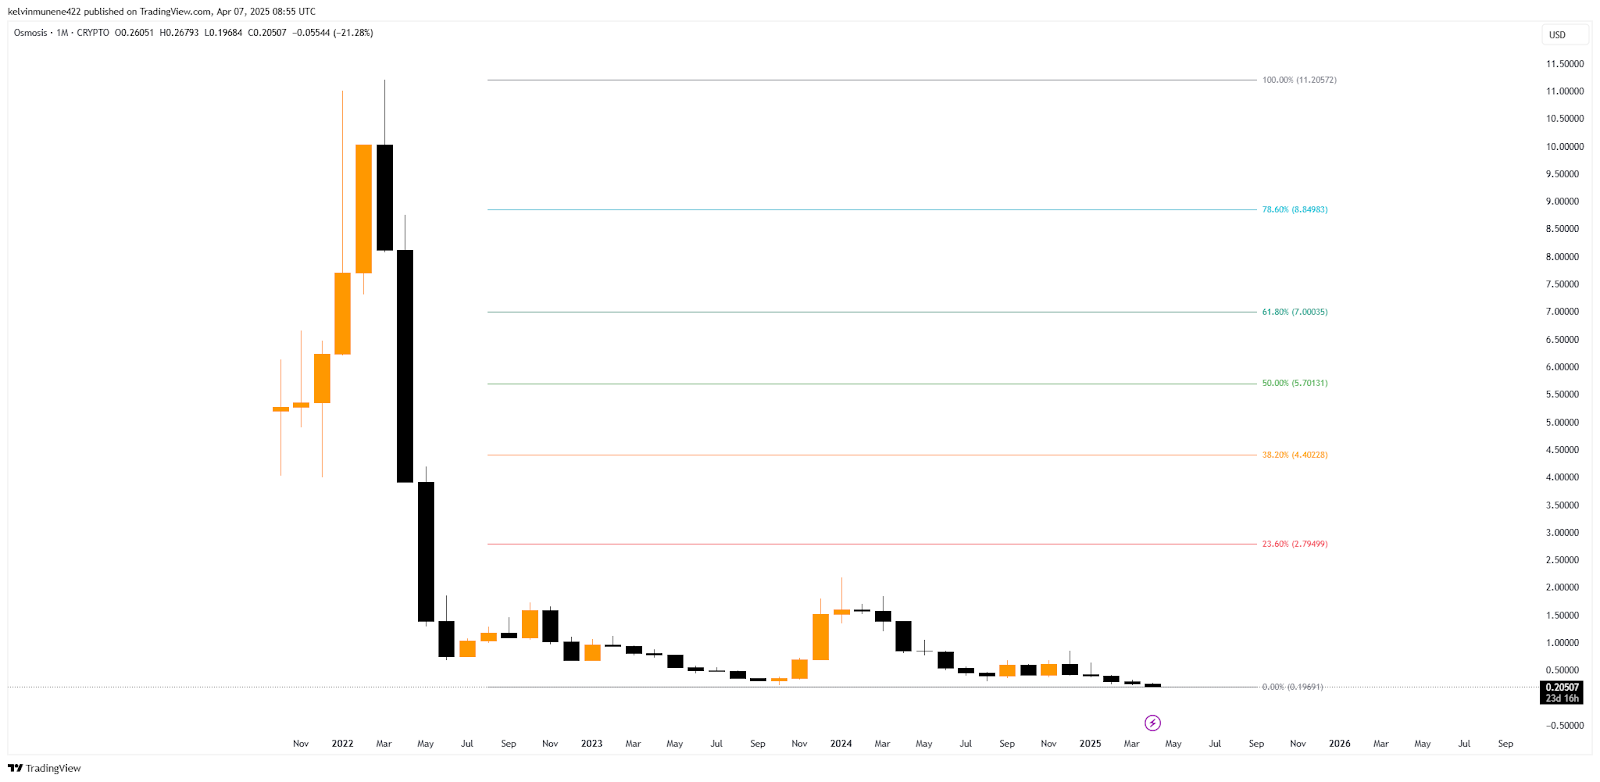
OSMO is trading just above the 0% Fibonacci retracement level, which is around $0.19. This places the token at the bottom of the Fibonacci range, highlighting how far the cryptocurrency’s price has dropped from its all-time high of $11.21, which marks the 100% Fib level.
The proximity to this floor shows that OSMO is in a deep retracement zone with no immediate sign of reversal. However, the first major resistance on the Fibonacci scale sits at $2.79499 (23.6%), followed by $4.40228 (38.2%), which reflect past breakdown levels. If OSMO attempts a recovery, these levels will likely act as key barriers.
 Source:
TradingView
Source:
TradingView
The 50% mark at $5.70131 and the 61.8% level at $7.00035 represent deeper retracement targets and signal more assertive historical consolidation zones. The 78.6% level near $8.84983 has remained untouched since the fall, further emphasizing how wide the gap is between current levels and prior highs.
The downtrend remains intact until OSMO breaks through any of the mentioned levels, especially the 23.6% zone. Its position near the 0% Fib level shows minimal bullish effort, reinforcing continued weakness in price structure unless volume and momentum return decisively.
Osmosis (OSMO) Price Prediction 2025
As per CryptoTale’s projections, OSMO could reach between $0.10 and $7.00 in 2025 as the market rides the post-BTC halving wave. Strong speculation, increased liquidity, and broader interchain adoption may drive the token toward new cycle highs before correction begins.
Osmosis (OSMO) Price Prediction 2026
According to our price forecast, OSMO may drop to $2.50–$5.00 amid the broader crypto market recession. Weak momentum, declining volume, and heavy selloffs post-2025 highs could fuel a prolonged bearish trend as capital exits speculative positions.
Osmosis (OSMO) Price Prediction 2027
CryptoTale expects OSMO to consolidate between $1.00 and $3.50 in 2027. With prices stabilizing after deep corrections, long-term holders and developers may return, forming a base ahead of 2028’s halving-driven rally.
Osmosis (OSMO) Price Prediction 2028
As sentiment improves, OSMO may recover to the $5.00–$12.00 range in 2028. Network upgrades, increased staking, and interchain liquidity could attract fresh capital amid optimism toward the fifth BTC halving event.
Osmosis (OSMO) Price Prediction 2029
According to projections, OSMO could rally to $10.00–$25.00 in 2029. The post-halving hype has sparked strong bullish momentum across altcoins. Consequently, OSMO could benefit from new DeFi integrations and rising user activity on Cosmos appchains.
Osmosis (OSMO) Price Prediction 2030
CryptoTale’s forecast shows OSMO may attempt to revisit previous highs. However, mass profit-taking, saturation, and overvaluation could initiate a correction as the market transitions from euphoria to realism. This phase could place the token around the $7.00-$15.00 zone.
Osmosis (OSMO) Price Prediction 2031
OSMO may fall back to $4.50–$12.50 in 2031 amid fading hype and macro caution. Still, by Q4, early re-entries could stabilize prices as BTC halving anticipation for 2032 slowly lifts market confidence.
Osmosis (OSMO) Price Prediction 2032
Following the sixth BTC halving, OSMO may rise between $16.00 and $30.00, fueled by renewed inflows and a broader market turnaround. Upgrades across Cosmos IBC and sustained DeFi use may push user adoption higher.
Osmosis (OSMO) Price Prediction 2033
CryptoTale projects OSMO could surge to $25.00–$50.00 in 2033. Post-halving expansion, bullish momentum, and real-world blockchain use cases may boost credibility, inviting institutional and developer interest.
Osmosis (OSMO) Price Prediction 2034
OSMO may correct mildly to $20.50–$40.00 as short-term holders take profits. However, sustained staking demand and ecosystem maturity could stabilize prices and set the stage for the next leg up.
Osmosis (OSMO) Price Prediction 2035
Our forecast shows OSMO may hit a new ATH between $50.00 and $100.00 by 2035. As blockchain adoption matures and interchain functionality scales, OSMO could thrive amid a fully developed decentralized infrastructure.
Related: Cosmos Price Prediction 2025-35: Will It Hit $200 by 2035?
FAQs
What is OSMO?
OSMO is the native token of Osmosis, a decentralized exchange in the Cosmos ecosystem enabling cross-chain swaps through the Inter-Blockchain Communication (IBC) protocol.
How can I purchase OSMO?
You can purchase OSMO through supported exchanges such as Osmosis DEX or centralized platforms that list the token using crypto or fiat payment methods.
Is investing in OSMO a wise decision?
OSMO follows market cycles. While it offers utility and potential, investing carries risks. Evaluate based on your goals and the token’s long-term fundamentals.
What’s the best way to securely store OSMO?
Store OSMO in non-custodial wallets compatible with Cosmos, such as Keplr or Ledger, to maintain control and ensure private key protection.
Who is the founder of OSMO?
OSMO was developed by the team behind Osmosis Labs, co-founded by Sunny Aggarwal, a core contributor to Cosmos and Tendermint.
Which year was OSMO launched?
OSMO was launched in June 2021 as the governance and utility token powering the Osmosis decentralized exchange.
What is OSMO’s circulating supply?
Currently, OSMO’s circulating supply is approximately 720.71 million tokens, according to data from CoinMarketCap.
Will OSMO surpass its all-time high?
According to forecasts, OSMO could surpass its $11.21 ATH amid blockchain adoption and market expansion.
What is OSMO’s lowest price?
OSMO’s all-time low was $0.1972 as of April 7, 2025, following a long-term downtrend from its 2022 market top.
What will the price of OSMO be in 2025?
OSMO is projected to trade between $0.10 and $7.00 in 2025, driven by post-BTC halving sentiment and speculation.
What will the price of OSMO be in 2028?
In 2028, OSMO could rise to $5.00–$12.00 amid network growth and optimism ahead of the fifth BTC halving.
What will the price of OSMO be in 2030?
CryptoTale forecasts OSMO trading between $7.00 and $15.00 in 2030 during a correction phase after the euphoric 2029 rally.
What will the price of OSMO be in 2032?
Following the BTC halving, OSMO may range between $16.00 and $30.00 in 2032 due to renewed inflows and market recovery.
What will the price of OSMO be in 2035?
Forecasts suggest OSMO may reach $50.00–$100.00 in 2035 as adoption matures and interchain functionality gains global traction.
The post Osmosis Price Prediction 2025-35: Will It Hit $100 by 2035? appeared first on Cryptotale.
Disclaimer: The content of this article solely reflects the author's opinion and does not represent the platform in any capacity. This article is not intended to serve as a reference for making investment decisions.
You may also like
Donald Trump’s Memecoin to Face $320 Million Token Unlock as Price Dips

33% of French looking to buy crypto in 2025 but Italians are even more bullish
Share link:In this post: A third of French people intend to purchase cryptocurrencies this year. New study shows Italians as most bullish among surveyed nations in Europe. The crypto sector’s growing legitimacy helps attract more investors, researchers say.
Spanish Police End Crypto Scam Ring That Used AI to Swipe $21 Million From Investors

Survey reveals 1 in 5 Americans own crypto, with 76% reporting personal benefits