Celestia (TIA) Mirrors DOT’s Bottoming Pattern – What’s the Fractal Hinting at?

Date: Wed, April 09, 2025 | 11:30 AM GMT
The cryptocurrency market has been stuck in a deep correction, with Ethereum (ETH) posting its worst Q1 performance since 2018 — plunging by a massive 56% so far this year. This weakness has spilled over to most altcoins , dragging prices lower across the board.
Among the hardest hit is Celestia (TIA), which has lost nearly half of its value since the start of 2025. But what’s interesting now is the pattern developing on its chart — one that looks strikingly similar to Polkadot’s (DOT) post-2021 setup.
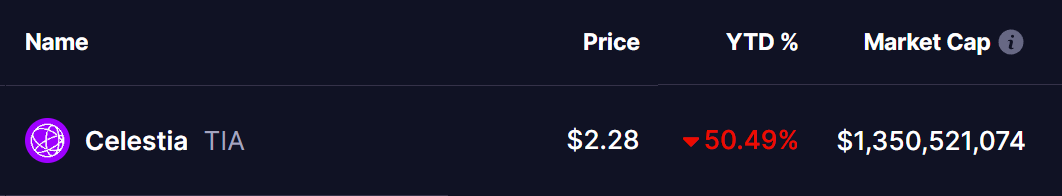 Source: Coinmarketcap
Celestia (TIA) Mirrors DOT’s Bottoming Pattern
Celestia (TIA) is now showing a chart pattern that feels oddly familiar, especially to anyone who followed Polkadot (DOT) during its post-2021 cycle. Both tokens experienced a sharp rally, followed by a deep crash, and then started forming almost identical structures on the daily chart.
Just like DOT, TIA formed a clear Head Shoulders pattern before slipping into a prolonged downtrend. After losing momentum, both charts show a retest of the previous support zone, which flipped into resistance and rejected any breakout attempts. What came next was a long, grinding phase below the 50-day moving average, ending in a flat accumulation range that seems to be the current stage for both.
Here’s where the comparison gets even more interesting. DOT has now spent more than 1,160 days trapped inside its consolidation range — and it still hasn’t managed to break out. Despite occasional bounces, the broader structure has stayed intact, keeping price action tight and mostly horizontal for years.
This fractal now seems to be repeating with TIA, suggesting that the token could be entering a similar long-term consolidation phase. It doesn’t necessarily mean the project is weak, but it does signal that a breakout might not come quickly, and those expecting an immediate rally could end up disappointed.
However, if TIA manages to decouple from this fractal and break out of the pattern early, it would completely invalidate the comparison — and that might actually be a good thing for investors. After all, most wouldn’t be excited to wait through a 3-year consolidation. A fresh move outside this structure could be the first real sign of strength and renewed momentum.
Disclaimer: This article is for informational purposes only and not financial advice. Always conduct your own research before investing in cryptocurrencies.
Disclaimer: The content of this article solely reflects the author's opinion and does not represent the platform in any capacity. This article is not intended to serve as a reference for making investment decisions.
You may also like
What it would take for bitcoin to top all-time highs
Forward Guidance’s Felix Jauvin noted that he’s bullish on both crypto and bitcoin on a “mean reversion basis”
Crypto ETFs and staking, the next big thing?
EU regulator says cryptocurrencies aren’t a threat
Solana Spot ETF to Launch in Canada This Week, Supporting Token Staking