SPX6900 (SPX) in Green Despite Market Turbulence – Is a Strong Rebound Coming?

Date: Mon, April 07, 2025 | 12:10 PM GMT
While most of the crypto market bleeds red today due to the escalating global tariff war—triggered by U.S. President Donald Trump’s aggressive trade sanctions—one memecoin is unexpectedly bucking the trend: SPX6900 (SPX).
As Bitcoin (BTC) falls by 7% and Ethereum (ETH) plunges by a dramatic 17%, many altcoins are down by double digits. Yet, SPX6900 is flashing green, showing a rare resilience in today’s sea of red, with its technical setup hinting at a potential recovery from its sharp 90-day decline.
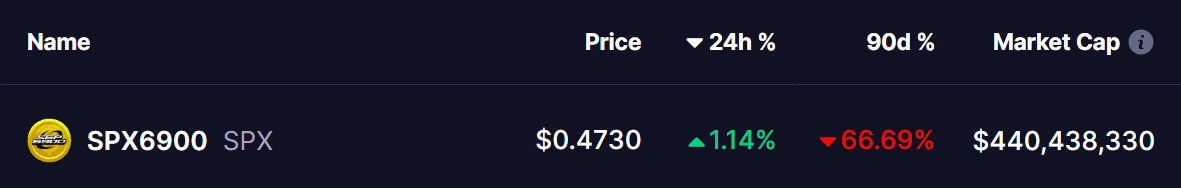 Source: Coinmarketcap
Chart Hints at Potential Rebound
On the daily chart, SPX6900 appears to be trading inside an expanding triangle formation—a rare but powerful technical setup that often precedes explosive breakout moves.
This triangle is characterized by higher highs and lower lows, each bounce and rejection forming off of long-term trendlines. The latest major correction began after SPX was rejected from the upper resistance trendline near $1.77 (its all-time high) on January 20. This rejection triggered a steep decline of more than 80%, eventually testing the support trendline at $0.25 on March 11, where a cluster of buyers re-entered the market.
History May Repeat Itself
Since then, SPX has shown signs of recovery, bouncing back into a consolidation zone marked in green. The price is currently hovering around its 50-day and 75-day moving averages (MA)—a technical crossroads that also marked the beginning of a 136% rally back in December.
The setup now looks eerily similar to the December pattern, where a bullish moving average crossover ignited a strong upside rally. If the 50 MA crosses above the 75 MA again while SPX remains stable in the current consolidation zone, we could be looking at the beginning of a similar rebound.
The upper resistance trendline currently sits around $2.75 to $3.0, offering potential upside of over 200% if the triangle plays out like the previous wave.
The MACD indicator remains neutral, but the histogram shows a potential shift toward the positive side. A sustained break above the moving averages would likely signal strength and attract bullish momentum traders.
Conclusion
In a market gripped by fear and global instability, SPX6900’s resilience is a breath of fresh air. While it remains a high-risk memecoin, the technical setup suggests a potential trend reversal and breakout opportunity for those watching closely.
If history is any guide, and if the expanding triangle holds true, SPX might just be setting up for another run to its upper trendline—but as always, caution and proper risk management are key.
Disclaimer: This article is for informational purposes only and not financial advice. Always conduct your own research before investing in cryptocurrencies.
Disclaimer: The content of this article solely reflects the author's opinion and does not represent the platform in any capacity. This article is not intended to serve as a reference for making investment decisions.
You may also like
$106 Million In Ethereum Liquidated: Crypto Whale Erased By The Ongoing Storm

Conor McGregor's REAL Token: A Resounding Failure

The CAC 40 Below 6900 Points: Geopolitical Tensions Weigh Heavily On The Market
Bitcoin: Traders Face Record-Breaking Losses