Stellar’s (XLM) Current Downtrend Mirrors 2020 Pattern — Is a Major Rebound Coming?

Date: Sun, April 06, 2025 | 04:25 PM GMT
The cryptocurrency market has been struggling with an extended correction phase, where Ethereum (ETH) itself recorded its worst Q1 decline since 2018—down nearly 45%. This widespread weakness has added heavy pressure on altcoins.
Among the major altcoins , Stellar (XLM) hasn’t been spared. The token has dropped 45% over the last 90 days, wiping out a significant portion of investor confidence. But beneath this gloomy surface, the chart tells a potentially exciting story—a setup that strongly resembles the price structure seen right before XLM’s explosive rally in late 2020 and early 2021.
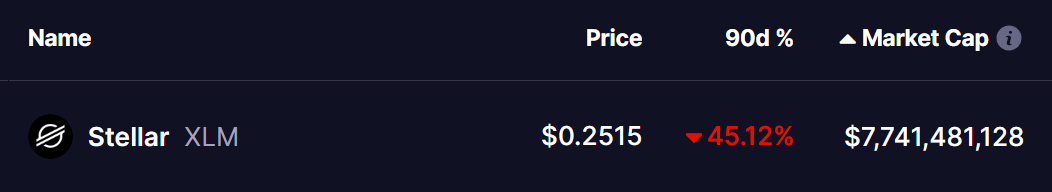 Source: Coinmarketcap
Chart Mirrors 2021 Bull Run Setup
Looking at the weekly chart, a striking similarity is emerging between XLM’s current structure and its late 2020 behavior. Back then, XLM faced a 53% correction from its local high before rebounding sharply in the months that followed. Now in 2025, the token has seen a similar 60% correction after a strong initial rally in Q4 2024.
In both cases, price consolidated around the 50-week and 100-week moving averages. Notably, during the 2020 cycle, once the price stabilized above the 100-week MA and volume began to return, XLM exploded upward by 382% from the green accumulation zone during the 2021 bull run.
The current setup looks eerily familiar. The token is hovering above both the 50 and 100 MAs, just like it did back then. The MACD is also starting to round off at the bottom, a technical signal that previously preceded XLM’s breakout. The histogram is slowly losing bearish momentum—similar to what was observed before the 2021 reversal.
Can XLM Repeat History?
Of course, past performance doesn’t guarantee future results, but the structural similarity is difficult to ignore. XLM appears to be in the latter stages of a consolidation phase, just like it was in late 2020. If momentum builds and the broader market stabilizes, there’s a decent chance XLM could repeat that breakout pattern.
That said, confirmation will depend on a few things: a bullish MACD crossover, increasing volume, and reclaiming key levels above $0.30. Traders and long-term holders will be watching closely to see if this familiar pattern plays out once again.
Disclaimer: This article is for informational purposes only and not financial advice. Always conduct your own research before investing in cryptocurrencies.
Disclaimer: The content of this article solely reflects the author's opinion and does not represent the platform in any capacity. This article is not intended to serve as a reference for making investment decisions.
You may also like
$106 Million In Ethereum Liquidated: Crypto Whale Erased By The Ongoing Storm

Conor McGregor's REAL Token: A Resounding Failure

The CAC 40 Below 6900 Points: Geopolitical Tensions Weigh Heavily On The Market
Bitcoin: Traders Face Record-Breaking Losses