PEPE Price Poised for a Massive Rally?
As the meme coin madness continues to grip the crypto market in 2025, PEPE price finds itself quietly preparing for what could be its next breakout moment. After months of consolidation and relentless selling pressure, subtle signals are flashing across both the daily and hourly charts. Is PEPE price about to springboard toward a new local high, or will this momentum be short-lived? Let’s dive into the technicals.
PEPE Price Prediction: Is PEPE Showing Signs of a Reversal on the Daily Chart?
 PEPE/USD Daily Chart- TradingView
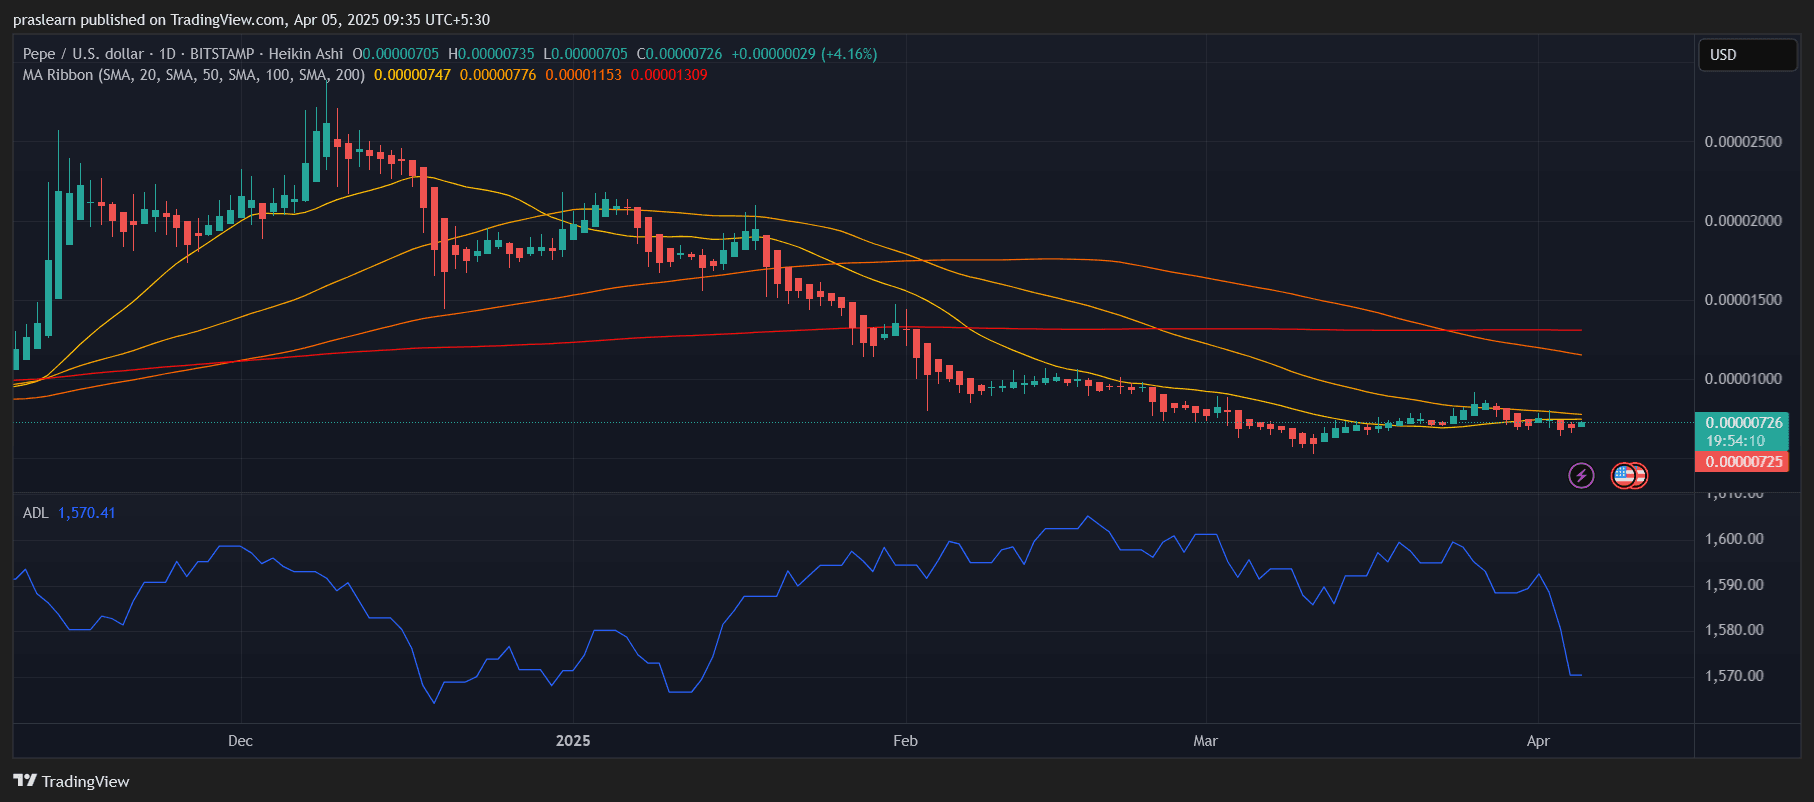
PEPE’s daily chart is finally showing some life after a prolonged downtrend. Currently priced around $0.000000726, the price has gained over 4% in the last 24 hours. This modest rally is taking place just as the asset hovers slightly below the 50-day SMA (Simple Moving Average) — a level that often acts as dynamic resistance. What's interesting is the price compression between the 20-day and 50-day SMAs, indicating a possible breakout setup.
However, the 100-day and 200-day SMAs remain far above, at $0.000001153 and $0.000001309 respectively, reminding traders of the significant overhead resistance. This confirms that PEPE is still in a broader bearish structure but is showing short-term bullish intent.
A key signal to watch is the Accumulation/Distribution Line (ADL), which has slightly ticked down despite the price rise. This divergence suggests that while retail interest may be increasing, large players or institutions are not yet accumulating in bulk. If the ADL starts trending upward along with price, this would be a strong bullish confirmation.
--> Wanna trade PEPE? Now is the perfect time, especially that the market is consolidating before a volatile period. Click here to open an account with Bitget using our link and benefit from 100% transaction fee rebates in BGB on your first transaction <--
What Does the Hourly Chart Reveal About Immediate Momentum?
 PEPE/USD 1 Hr Chart- TradingView
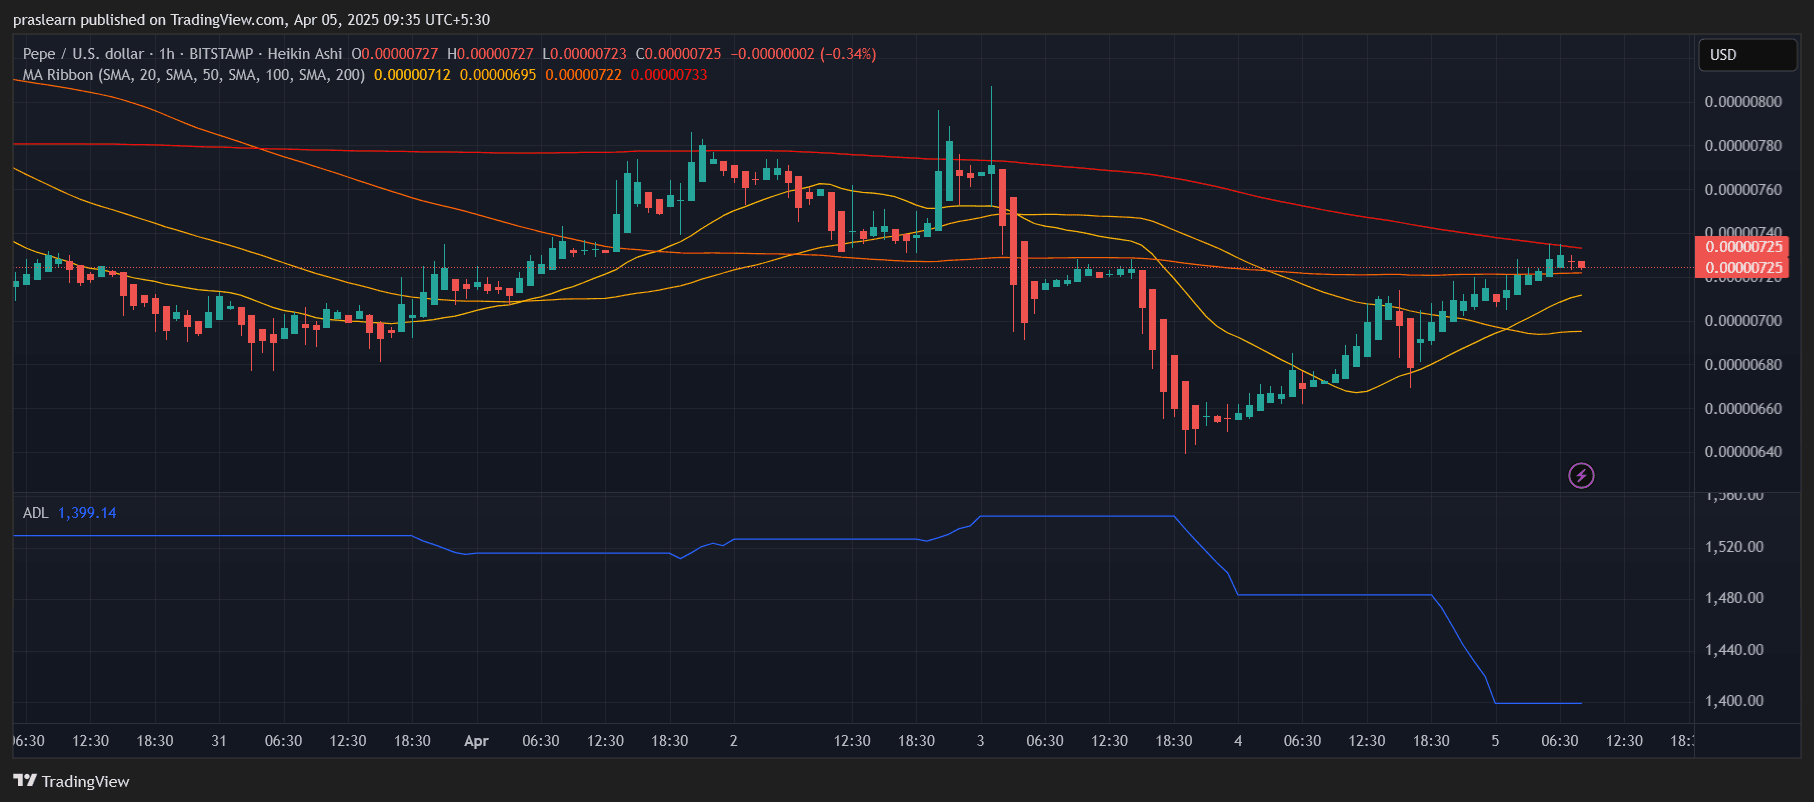
Zooming into the hourly chart, PEPE has been gradually climbing back from a local low of around $0.00000064, reclaiming short-term moving averages along the way. Currently, the price is facing resistance from the 200-hour SMA, sitting right at $0.000000733. This level has proven difficult to breach, as seen by the multiple candle wicks testing but failing to close above it.
The PEPE price is comfortably above the 20-, 50-, and 100-hour SMAs , suggesting that bulls are gaining control in the short term. The structure is beginning to resemble a bullish flag breakout, with volume picking up slightly in recent sessions.
What’s also notable is the behavior of the ADL on the hourly chart, which has been relatively flat around 1399. This confirms the narrative that although price is pushing upward, there isn’t yet strong backing from volume or large wallets—again pointing to a cautiously bullish but not yet explosive scenario.
Are There Hidden Bullish Catalysts or Traps?
From a pattern standpoint, PEPE is trying to break out of a descending channel that started forming back in early February. If bulls can hold the current zone and push decisively past the $0.00000077 resistance, then the next likely targets are $0.00000090 and eventually $0.00000115 — which aligns with the 100-day SMA.
However, failure to break and hold above the 200-hour SMA in the short term could send PEPE price back into the $0.00000068 to $0.00000070 range, where it’s seen strong support over the past week.
Momentum remains tentative, and the real confirmation will come only when PEPE breaks above the SMA cluster between 50-day and 100-day with strong volume. For now, traders should watch for a clean breakout above $0.00000074, ideally supported by a rising ADL and increased Heikin Ashi candle body size, which would confirm sustained buying pressure.
PEPE Price Prediction: What's Next for PEPE?
PEPE’s price structure is showing signs of short-term bullish revival , especially on the hourly chart. However, the daily chart suggests caution — larger trendlines are still unbroken, and volume hasn't fully returned. If momentum persists and is backed by strong inflows, PEPE could challenge its next local resistance at $0.00000090 in the coming days.
But until we see confirmation via breakout volume and institutional accumulation (reflected in the ADL), the rally remains speculative. For now, PEPE is poised — but not yet committed — to a massive rally.
As the meme coin madness continues to grip the crypto market in 2025, PEPE price finds itself quietly preparing for what could be its next breakout moment. After months of consolidation and relentless selling pressure, subtle signals are flashing across both the daily and hourly charts. Is PEPE price about to springboard toward a new local high, or will this momentum be short-lived? Let’s dive into the technicals.
PEPE Price Prediction: Is PEPE Showing Signs of a Reversal on the Daily Chart?
 PEPE/USD Daily Chart- TradingView
PEPE’s daily chart is finally showing some life after a prolonged downtrend. Currently priced around $0.000000726, the price has gained over 4% in the last 24 hours. This modest rally is taking place just as the asset hovers slightly below the 50-day SMA (Simple Moving Average) — a level that often acts as dynamic resistance. What's interesting is the price compression between the 20-day and 50-day SMAs, indicating a possible breakout setup.
However, the 100-day and 200-day SMAs remain far above, at $0.000001153 and $0.000001309 respectively, reminding traders of the significant overhead resistance. This confirms that PEPE is still in a broader bearish structure but is showing short-term bullish intent.
A key signal to watch is the Accumulation/Distribution Line (ADL), which has slightly ticked down despite the price rise. This divergence suggests that while retail interest may be increasing, large players or institutions are not yet accumulating in bulk. If the ADL starts trending upward along with price, this would be a strong bullish confirmation.
--> Wanna trade PEPE? Now is the perfect time, especially that the market is consolidating before a volatile period. Click here to open an account with Bitget using our link and benefit from 100% transaction fee rebates in BGB on your first transaction <--
What Does the Hourly Chart Reveal About Immediate Momentum?
 PEPE/USD 1 Hr Chart- TradingView
Zooming into the hourly chart, PEPE has been gradually climbing back from a local low of around $0.00000064, reclaiming short-term moving averages along the way. Currently, the price is facing resistance from the 200-hour SMA, sitting right at $0.000000733. This level has proven difficult to breach, as seen by the multiple candle wicks testing but failing to close above it.
The PEPE price is comfortably above the 20-, 50-, and 100-hour SMAs , suggesting that bulls are gaining control in the short term. The structure is beginning to resemble a bullish flag breakout, with volume picking up slightly in recent sessions.
What’s also notable is the behavior of the ADL on the hourly chart, which has been relatively flat around 1399. This confirms the narrative that although price is pushing upward, there isn’t yet strong backing from volume or large wallets—again pointing to a cautiously bullish but not yet explosive scenario.
Are There Hidden Bullish Catalysts or Traps?
From a pattern standpoint, PEPE is trying to break out of a descending channel that started forming back in early February. If bulls can hold the current zone and push decisively past the $0.00000077 resistance, then the next likely targets are $0.00000090 and eventually $0.00000115 — which aligns with the 100-day SMA.
However, failure to break and hold above the 200-hour SMA in the short term could send PEPE price back into the $0.00000068 to $0.00000070 range, where it’s seen strong support over the past week.
Momentum remains tentative, and the real confirmation will come only when PEPE breaks above the SMA cluster between 50-day and 100-day with strong volume. For now, traders should watch for a clean breakout above $0.00000074, ideally supported by a rising ADL and increased Heikin Ashi candle body size, which would confirm sustained buying pressure.
PEPE Price Prediction: What's Next for PEPE?
PEPE’s price structure is showing signs of short-term bullish revival , especially on the hourly chart. However, the daily chart suggests caution — larger trendlines are still unbroken, and volume hasn't fully returned. If momentum persists and is backed by strong inflows, PEPE could challenge its next local resistance at $0.00000090 in the coming days.
But until we see confirmation via breakout volume and institutional accumulation (reflected in the ADL), the rally remains speculative. For now, PEPE is poised — but not yet committed — to a massive rally.
Disclaimer: The content of this article solely reflects the author's opinion and does not represent the platform in any capacity. This article is not intended to serve as a reference for making investment decisions.
You may also like
Altcoin volumes are ‘more concentrated’ than ever
Altcoin trade volume has returned to pre-FTX levels, but with a shrinking pool of market leaders
Is Pi Network Headed to Zero? Price Crashes to New Low Below $0.60
Pi Network has suffered from a lack of trust in its project, as well as from a relative absence of big-name listings.

SUI Price Pops as Falling Wedge Breaks – Here’s What Happens Next
Sui has enjoyed considerable growth as a network in recent months, yet the market-wide downturn could mean that it underperforms for a while yet.

Ethereum Developers to Launch Pectra Upgrade Mainnet on May 7
As Ethereum looks to integrate institutional accessibility and scalability tech, the Pectra upgrade shows a strategic pivot in the blockchain’s battle to regain market dominance.
