Buy SHIB Now or Regret Later? This Chart May Have the Answer!
Shiba Inu (SHIB) , the meme-inspired token turned DeFi and metaverse contender, continues to attract speculative eyes despite its recent decline. After an explosive run in 2021, SHIB's price action has since cooled , hovering near support zones as investors await a catalyst. The latest daily and hourly charts reveal a tight tug-of-war between bears and bulls — but could a breakout be closer than it appears? Let’s dive deep into the current technical structure and what it could mean for SHIB holders in the days ahead.
Shiba Inu Price Prediction: Is SHIB Price Losing Momentum or Gearing Up for a Comeback?
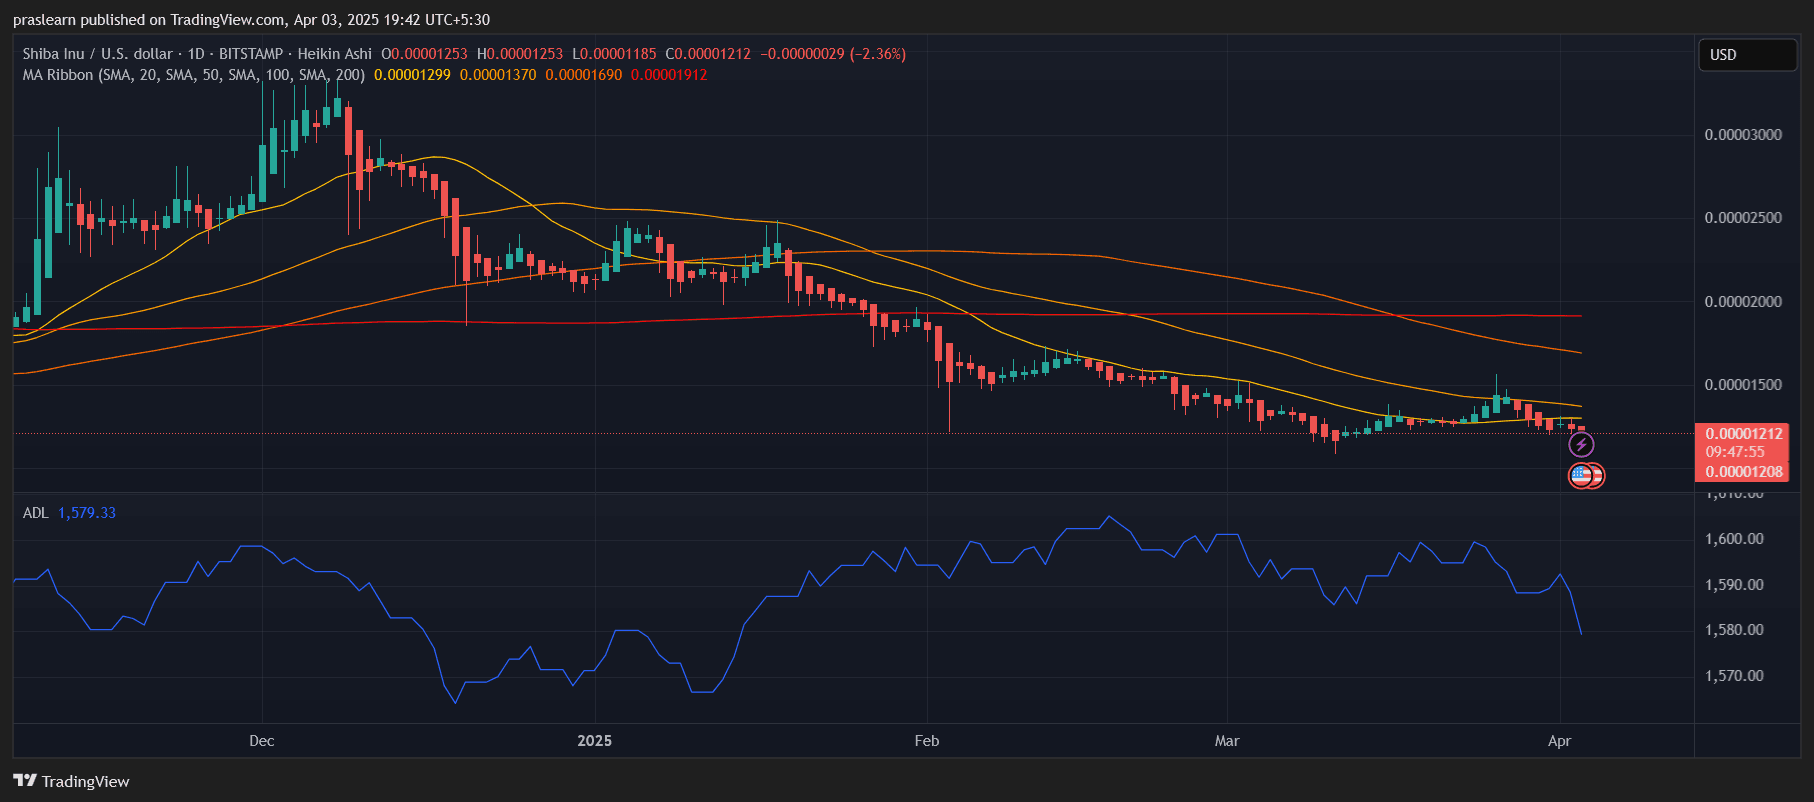
 SHIB/USD Daily Chart- TradingView
The daily chart paints a picture of prolonged bearish pressure. SHIB price is currently trading at $0.00001212 , marking a 2.36% decline for the day. More importantly, the price has continued to reject the 50-day Simple Moving Average (SMA) and remains under all key SMAs — the 20, 50, 100, and 200-day — a clear sign of bearish dominance.
The Moving Average Ribbon (SMA Ribbon) reveals a descending alignment, with no sign of crossover, which generally indicates a sustained downtrend. The 200-day SMA at $0.00001912 is especially significant; reclaiming it would mark a major trend reversal. Until then, SHIB remains in a long-term downtrend .
Volume indicators, while not explicitly shown here, correlate with the Accumulation/Distribution Line (ADL), which is flattening and showing a slight decline — implying that whales and smart money are not actively accumulating at current levels. This weak accumulation could mean investors are waiting for a stronger dip or a news-driven catalyst.
--> Click here to Buy SHIB on Bitget <--
Can Hourly Charts Offer a Short-Term Relief Rally?
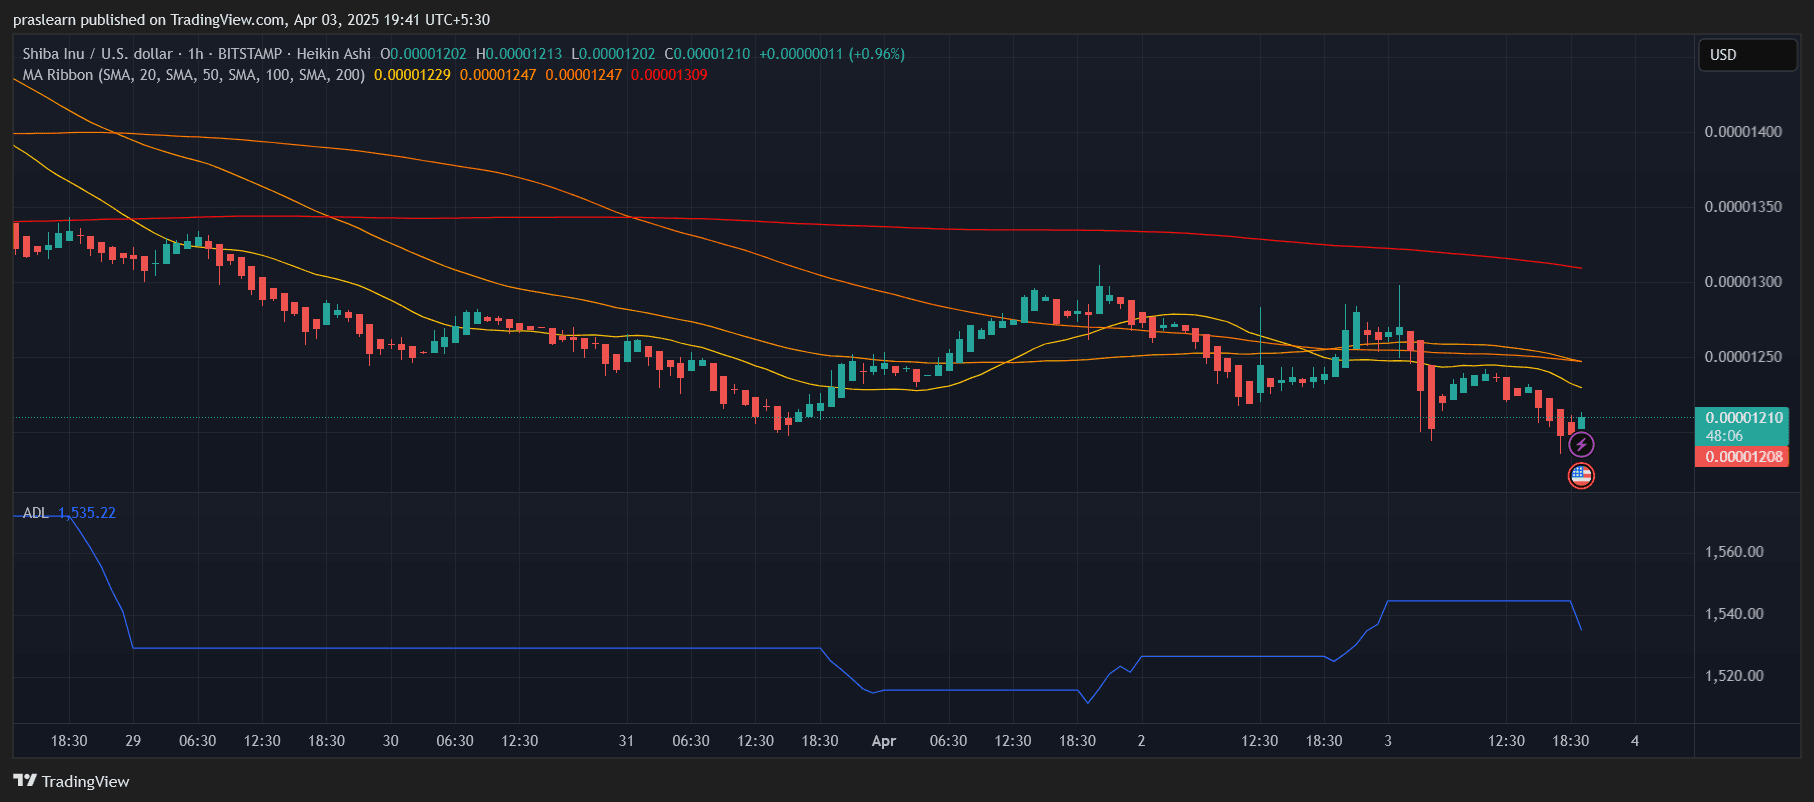
 SHIB/USD 1 Hr Chart- TradingView
Switching to the hourly chart, the picture becomes a bit more nuanced. Shiba Inu Price showed a slight intraday rebound , gaining 0.96% from its previous hourly close. However, this bounce ran into immediate resistance at the 50-hour SMA, currently around $0.00001247, and got rejected. This intraday weakness indicates that short-term bulls lack conviction.
Interestingly, the ADL on the hourly chart is attempting to curl upward after forming a base, suggesting small pockets of accumulation during dips. However, this remains weak and inconsistent. The 200-hour SMA looms above at $0.00001309, which now acts as the critical resistance barrier for any short-term recovery.
Despite the minor price uptick, the SMA Ribbon continues to slope downward — reinforcing the idea that any rallies may be short-lived unless a breakout over the 100-hour and 200-hour SMAs occurs with strong volume.
--> Click here to Buy SHIB on Bitget <--
What Are the Key Indicators Saying?
On the daily timeframe, the Heikin Ashi candles are red and flat-bottomed, confirming a strong bearish trend with no significant wicks to the downside — this implies clean selling pressure without much buying support. Unless SHIB price prints a green Heikin Ashi candle with a higher high and longer upper wick, the trend remains unchanged.
The SMA indicators are stacked bearishly (20 < 50 < 100 < 200), forming a classic downward ribbon. This is a textbook sign of a persistent downtrend with little chance of reversal unless a bullish crossover emerges — particularly the 20-day SMA flipping above the 50-day.
The ADL also reflects more distribution than accumulation, weakening the case for a near-term breakout.
On the hourly chart, while a small bounce occurred, the resistance at the 100-hour and 200-hour SMAs proved too strong. The ADL uptick may indicate a short squeeze or opportunistic buys, but it doesn't suggest a trend reversal just yet.
--> Click here to Buy SHIB on Bitget <--
Where Is SHIB Price Headed Next?
In the near term, if Shiba Inu price fails to hold support at $0.00001200, it could revisit recent lows near $0.00001150. On the flip side, a clean breakout above $0.00001250 with a strong green Heikin Ashi candle and bullish ADL divergence might push SHIB toward the psychological resistance at $0.00001300.
However, a sustainable uptrend would require SHIB price to break above $0.00001370 (the 100-day SMA) and reclaim $0.00001690 to invalidate the bearish structure and regain bullish momentum.
Shiba Inu Price Prediction: Time to Accumulate or Stay Cautious?
Right now, Shiba Inu is in no man's land — caught between weak support and strong resistance. The daily trend is decisively bearish, while the hourly chart hints at speculative bounces rather than solid accumulation.
Unless a news catalyst, such as a SHIB ecosystem update or broader crypto rally, injects new volume, it’s likely that Shiba Inu price will continue to drift or drop further. For traders, this is a wait-and-watch zone. For long-term holders, any deeper dip may provide a better accumulation opportunity — but only with risk management in place.
Shiba Inu (SHIB) , the meme-inspired token turned DeFi and metaverse contender, continues to attract speculative eyes despite its recent decline. After an explosive run in 2021, SHIB's price action has since cooled , hovering near support zones as investors await a catalyst. The latest daily and hourly charts reveal a tight tug-of-war between bears and bulls — but could a breakout be closer than it appears? Let’s dive deep into the current technical structure and what it could mean for SHIB holders in the days ahead.
Shiba Inu Price Prediction: Is SHIB Price Losing Momentum or Gearing Up for a Comeback?
 SHIB/USD Daily Chart- TradingView
The daily chart paints a picture of prolonged bearish pressure. SHIB price is currently trading at $0.00001212 , marking a 2.36% decline for the day. More importantly, the price has continued to reject the 50-day Simple Moving Average (SMA) and remains under all key SMAs — the 20, 50, 100, and 200-day — a clear sign of bearish dominance.
The Moving Average Ribbon (SMA Ribbon) reveals a descending alignment, with no sign of crossover, which generally indicates a sustained downtrend. The 200-day SMA at $0.00001912 is especially significant; reclaiming it would mark a major trend reversal. Until then, SHIB remains in a long-term downtrend .
Volume indicators, while not explicitly shown here, correlate with the Accumulation/Distribution Line (ADL), which is flattening and showing a slight decline — implying that whales and smart money are not actively accumulating at current levels. This weak accumulation could mean investors are waiting for a stronger dip or a news-driven catalyst.
--> Click here to Buy SHIB on Bitget <--
Can Hourly Charts Offer a Short-Term Relief Rally?
 SHIB/USD 1 Hr Chart- TradingView
Switching to the hourly chart, the picture becomes a bit more nuanced. Shiba Inu Price showed a slight intraday rebound , gaining 0.96% from its previous hourly close. However, this bounce ran into immediate resistance at the 50-hour SMA, currently around $0.00001247, and got rejected. This intraday weakness indicates that short-term bulls lack conviction.
Interestingly, the ADL on the hourly chart is attempting to curl upward after forming a base, suggesting small pockets of accumulation during dips. However, this remains weak and inconsistent. The 200-hour SMA looms above at $0.00001309, which now acts as the critical resistance barrier for any short-term recovery.
Despite the minor price uptick, the SMA Ribbon continues to slope downward — reinforcing the idea that any rallies may be short-lived unless a breakout over the 100-hour and 200-hour SMAs occurs with strong volume.
--> Click here to Buy SHIB on Bitget <--
What Are the Key Indicators Saying?
On the daily timeframe, the Heikin Ashi candles are red and flat-bottomed, confirming a strong bearish trend with no significant wicks to the downside — this implies clean selling pressure without much buying support. Unless SHIB price prints a green Heikin Ashi candle with a higher high and longer upper wick, the trend remains unchanged.
The SMA indicators are stacked bearishly (20 < 50 < 100 < 200), forming a classic downward ribbon. This is a textbook sign of a persistent downtrend with little chance of reversal unless a bullish crossover emerges — particularly the 20-day SMA flipping above the 50-day.
The ADL also reflects more distribution than accumulation, weakening the case for a near-term breakout.
On the hourly chart, while a small bounce occurred, the resistance at the 100-hour and 200-hour SMAs proved too strong. The ADL uptick may indicate a short squeeze or opportunistic buys, but it doesn't suggest a trend reversal just yet.
--> Click here to Buy SHIB on Bitget <--
Where Is SHIB Price Headed Next?
In the near term, if Shiba Inu price fails to hold support at $0.00001200, it could revisit recent lows near $0.00001150. On the flip side, a clean breakout above $0.00001250 with a strong green Heikin Ashi candle and bullish ADL divergence might push SHIB toward the psychological resistance at $0.00001300.
However, a sustainable uptrend would require SHIB price to break above $0.00001370 (the 100-day SMA) and reclaim $0.00001690 to invalidate the bearish structure and regain bullish momentum.
Shiba Inu Price Prediction: Time to Accumulate or Stay Cautious?
Right now, Shiba Inu is in no man's land — caught between weak support and strong resistance. The daily trend is decisively bearish, while the hourly chart hints at speculative bounces rather than solid accumulation.
Unless a news catalyst, such as a SHIB ecosystem update or broader crypto rally, injects new volume, it’s likely that Shiba Inu price will continue to drift or drop further. For traders, this is a wait-and-watch zone. For long-term holders, any deeper dip may provide a better accumulation opportunity — but only with risk management in place.
Disclaimer: The content of this article solely reflects the author's opinion and does not represent the platform in any capacity. This article is not intended to serve as a reference for making investment decisions.
You may also like
US equities slide as trade war escalates, Powell signals no rate cut
Tariff and interest rate concerns overshadowed a positive March jobs report
Sei Investments increases 39% stake in MicroStrategy

Fidelity Spot Solana ETF Gains Traction As SEC Acknowledges Filing

Paul Atkins Moves Closer to SEC Chair Role After Senate Committee Approval

