- Chainlink is expected to trade between $14.25 and $30.89 in 2025, with an average price projection of $22.37 based on technical analysis.
- A breakout above $17.75 could confirm a bullish reversal, pushing LINK toward $25-$30 by year-end.
- If market sentiment remains strong, LINK could test the $30 resistance zone, marking a potential cycle high before 2026.
Chainlink is a decentralized blockchain oracle network that enables smart contracts to interact with real-world data securely. Launched in 2017 by Sergey Nazarov and Steve Ellis, it solves the oracle problem by acting as a bridge between blockchains and external data sources such as market prices, weather reports, and payments. This functionality is crucial for DeFi applications, NFTs, gaming, and enterprise blockchain solutions that rely on accurate external data.
The network operates through decentralized nodes that gather and verify information from multiple sources before delivering it on-chain. This ensures that data remains reliable, tamper-proof, and resistant to single points of failure. LINK, the platform’s native token, is used for paying node operators and securing the network. As of March 2025, LINK is trading at $14.18 with a market cap of around $9.3 billion.
Table of contents
- Recent Developments and Market Performance
- Chainlink (LINK) Price Prediction 2025-2030 Overview
- Bollinger Band Analysis for Chainlink (LINK)
- MACD Analysis for Chainlink (LINK)
- Relative Strength Index (RSI) Analysis for Chainlink (LINK)
- Support and Resistance Levels for Chainlink (LINK)
- Chainlink (LINK) 2025 Price Prediction Analysis
- Short-Term Outlook (Q1 – Q2 2025)
- Mid-Term Outlook (Q3 2025)
- Long-Term Outlook (Q4 2025)
- Final Prediction for 2025
- Chainlink (LINK) Price Prediction for 2026
- Chainlink (LINK) Price Prediction for 2027
- Chainlink (LINK) Price Prediction for 2028
- Chainlink (LINK) Price Prediction for 2029
- Chainlink (LINK) Price Prediction for 2030
- FAQs
Recent Developments and Market Performance
Chainlink has introduced Multistream, a major upgrade designed to boost data processing speeds by up to 1000x. This improvement strengthens its role as the leading oracle provider by enhancing efficiency and scalability. Additionally, Chainlink’s partnerships with major enterprises and blockchain networks continue to expand, reinforcing its position as a critical component of Web3 infrastructure.
In terms of price performance, LINK has gained 6.3% over the past week, outpacing the broader crypto market, which saw a more moderate rise. The demand for secure and decentralized data feeds continues to grow, positioning Chainlink as a key player in blockchain adoption across multiple industries.
With its continued innovation and strong use case, Chainlink remains one of the most influential projects in the decentralized ecosystem. Its expanding adoption in DeFi, insurance, AI-driven automation, and traditional finance integrations suggests it will continue to be a major force in blockchain infrastructure.
Chainlink (LINK) Price Prediction 2025-2030 Overview
| Year | Potential Low ($) | Potential Average ($) | Potential High ($) |
| 2025 | $14.250 | $22.375 | $30.890 |
| 2026 | $18.630 | $28.470 | $39.780 |
| 2027 | $22.940 | $36.825 | $50.520 |
| 2028 | $30.480 | $48.650 | $65.320 |
| 2029 | $38.750 | $60.910 | $85.460 |
| 2030 | $45.980 | $78.230 | $110.750 |
Bollinger Band Analysis for Chainlink (LINK)
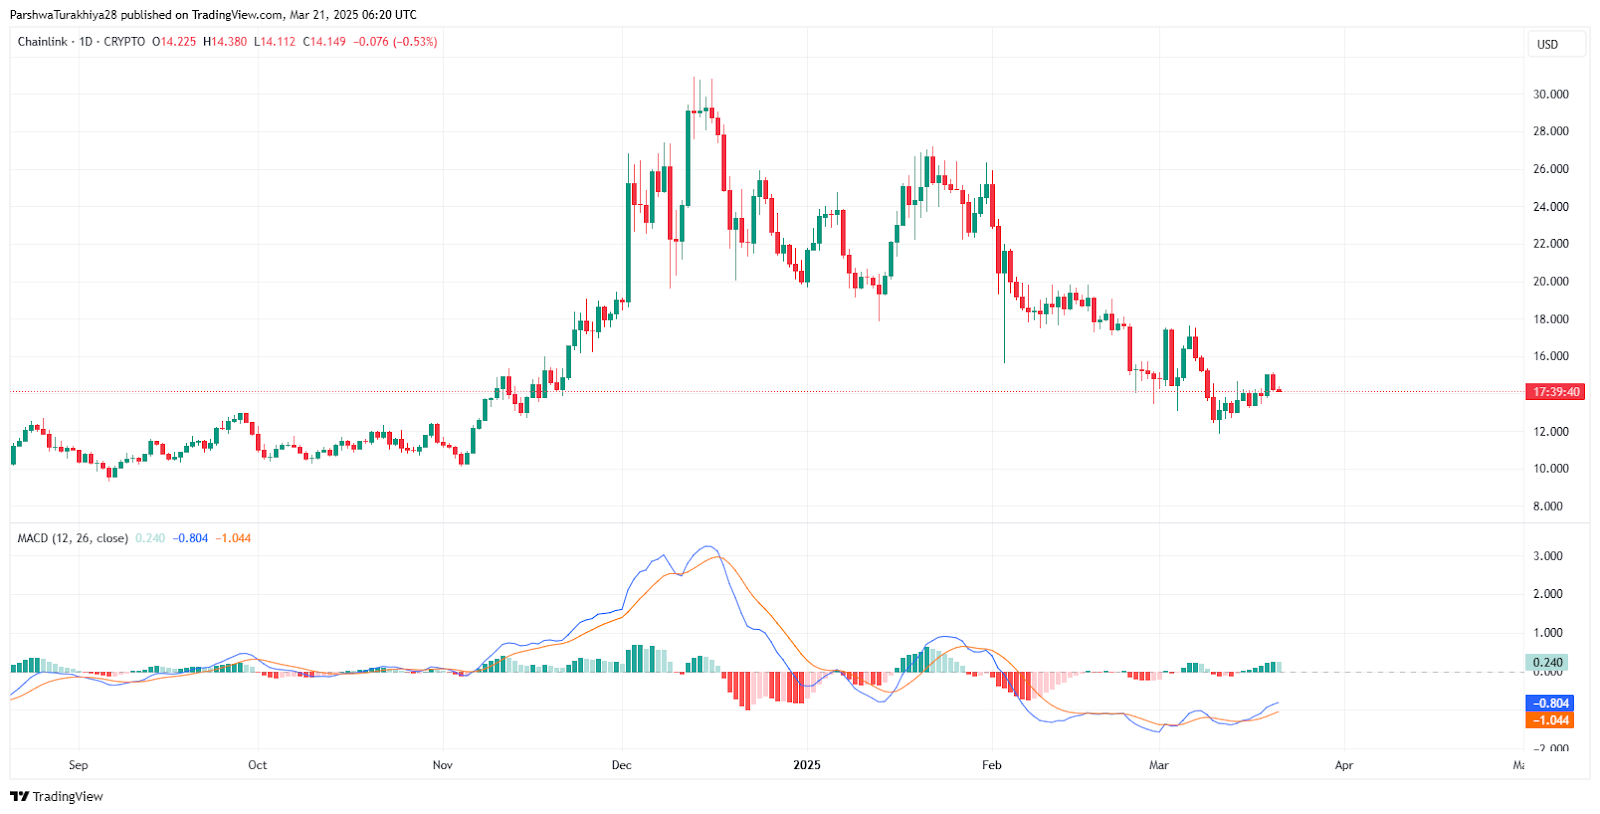
 Chainlink (LINK) price chart (Source: TradingView
)
Chainlink (LINK) price chart (Source: TradingView
)
The Bollinger Bands on the daily chart indicate a phase of increased volatility following a period of sideways movement. The price is currently testing the middle band, which is the 20-day simple moving average (SMA) at $14.49. This level is acting as a short-term pivot, and a breakout above this point would indicate increasing bullish momentum. The upper Bollinger Band is positioned at $17.09, serving as the next resistance level. If LINK manages to breach this resistance with strong buying volume, it could confirm a bullish reversal toward $19-$20 in the mid-term.
Conversely, the lower Bollinger Band sits at $11.89, representing the major support level. If LINK fails to hold above the middle band and declines, a retest of the lower band is likely, potentially driving the price back toward $12.00-$12.50. A sustained breakdown below this level could lead to a stronger bearish trend, with further declines expected toward $10.00. However, if the Bollinger Bands begin expanding with the price pushing higher, it would confirm an increase in bullish momentum and a potential rally.
MACD Analysis for Chainlink (LINK)
 Chainlink (LINK) price chart (Source: TradingView
)
Chainlink (LINK) price chart (Source: TradingView
)
The MACD (Moving Average Convergence Divergence) is showing early signs of a possible bullish crossover. Currently, the MACD line (0.24) is approaching the signal line (-0.80), suggesting that the bearish momentum is weakening. The histogram is beginning to print small green bars, indicating a reduction in selling pressure and an increase in buying interest.
If the MACD line crosses above the signal line, it would confirm a bullish reversal, potentially driving LINK toward $16-$18. Additionally, if the MACD histogram continues to expand with larger green bars, it would signal strengthening bullish momentum. However, if the MACD line fails to complete the crossover and starts declining again, it could indicate another leg down, with LINK revisiting the $12.50-$13.00 support range before attempting another move higher.
A sustained bullish crossover combined with increasing histogram bars would reinforce an optimistic outlook, with $19-$20 as the next upside target.
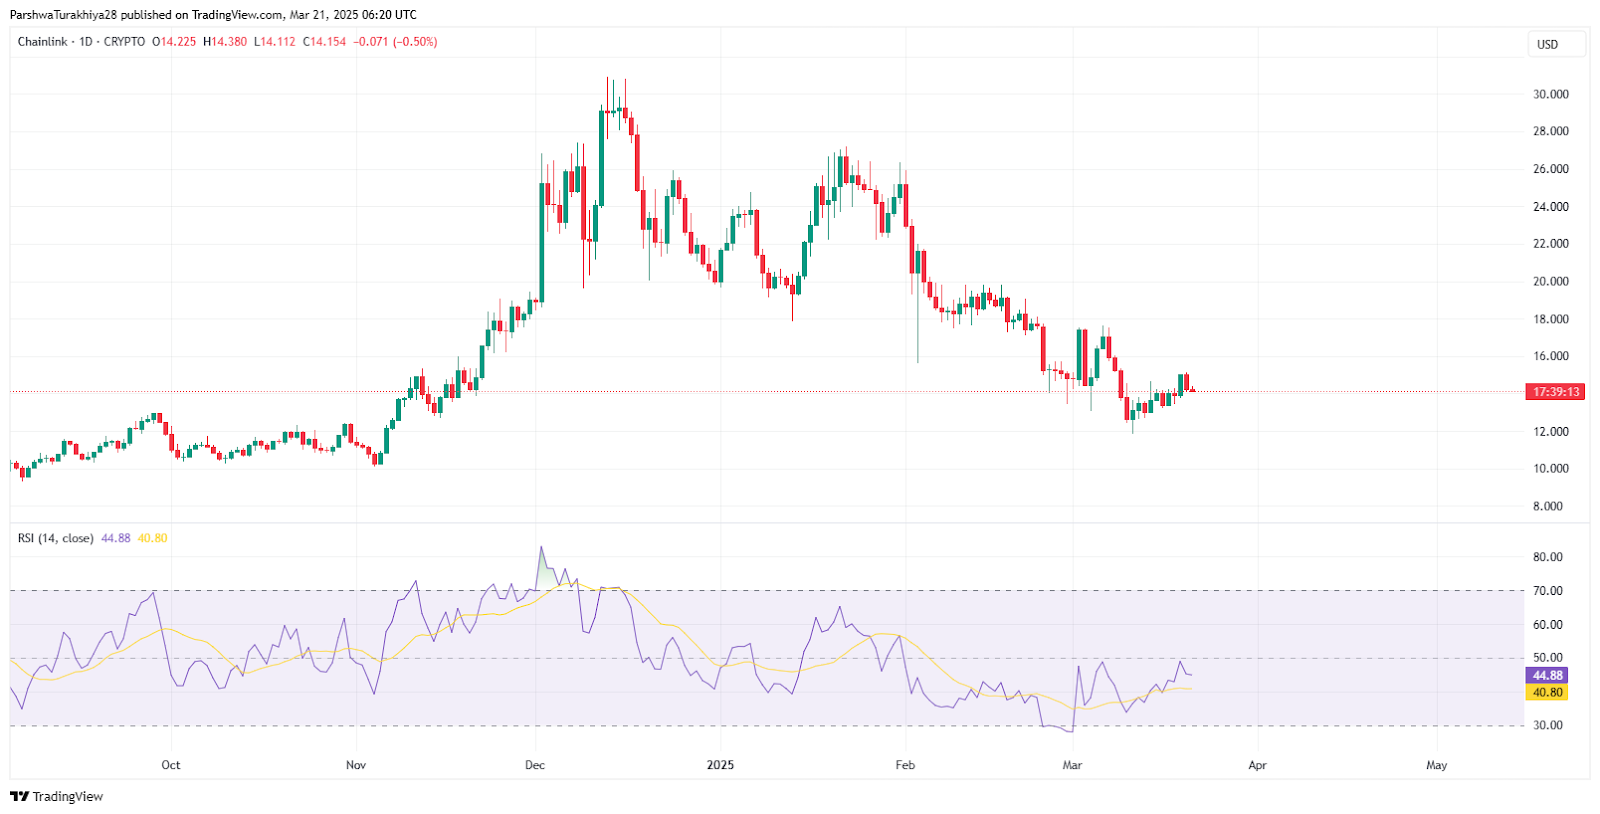
Relative Strength Index (RSI) Analysis for Chainlink (LINK)
 Chainlink (LINK) price dynamics (Source: TradingView
)
Chainlink (LINK) price dynamics (Source: TradingView
)
The RSI for Chainlink is currently at 44.88, reflecting weak momentum but showing signs of recovery from oversold conditions. Historically, an RSI below 50 suggests a neutral-to-bearish trend, while a breakout above 50-55 confirms renewed bullish momentum. The indicator has recently moved up from oversold territory (below 40), signaling that selling pressure is easing and a potential reversal could be forming.
If RSI continues to climb and crosses 50, it would indicate increasing buying interest, pushing LINK toward the $16-$17 range. However, if the RSI struggles to break past this level and starts declining below 40, it could reinforce bearish sentiment and lead to another downward move, potentially retesting $12-$13. Traders should closely watch for a break above 50-55, which could act as an early confirmation of a trend reversal toward $18-$19.
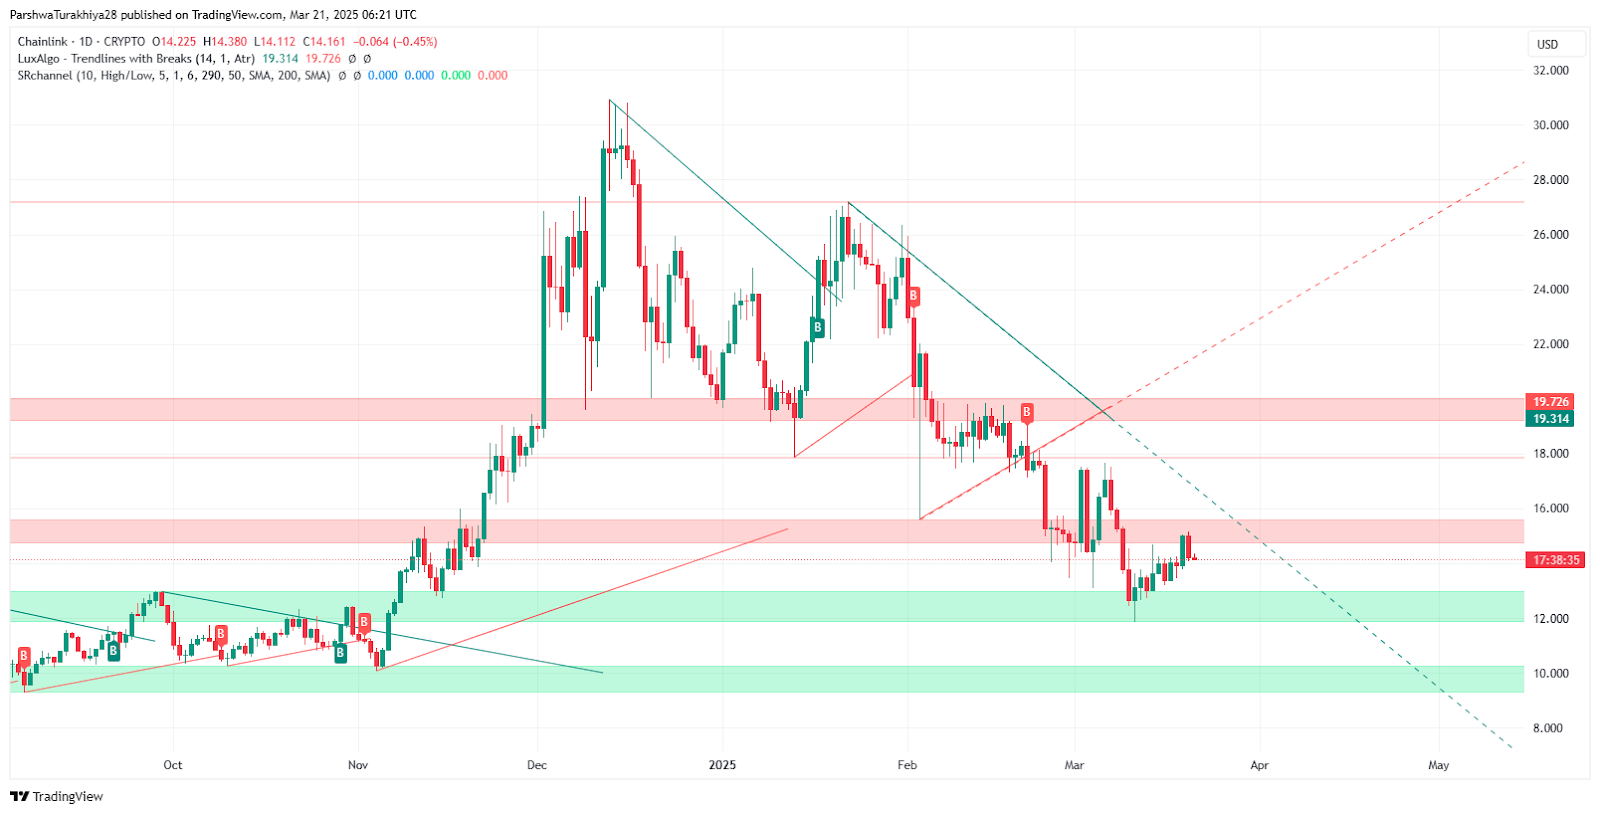
Support and Resistance Levels for Chainlink (LINK)
 Chainlink (LINK) price chart (Source: TradingView
)
Chainlink (LINK) price chart (Source: TradingView
)
Support Levels:
- $12.00 – $12.50: This range aligns with previous accumulation zones where buyers stepped in. A breakdown below this level would confirm increased bearish pressure, potentially pushing LINK toward $10.00.
- $10.00 – $11.00: A historical support zone that served as a major accumulation level. If this level is tested, it could provide strong buying interest, preventing further declines.
Resistance Levels:
- $16.00 – $17.00: A key resistance level that coincides with the upper Bollinger Band. A breakout above this range would confirm a bullish shift.
- $19.30 – $19.70: A significant resistance zone, aligning with trendline resistance and historical supply levels. If LINK clears this level, it could open the door for a push toward $22-$25.
- $25.00 – $28.00: The final resistance before LINK enters a strong bullish trend. This area marked past distribution zones where selling pressure emerged.
A successful breakout above $17.00 would strengthen bullish sentiment, with $19.30-$19.70 as the next key target. However, failure to breach these levels could result in LINK consolidating between $12.50 – $16.00 before attempting another breakout.
Chainlink (LINK) 2025 Price Prediction Analysis
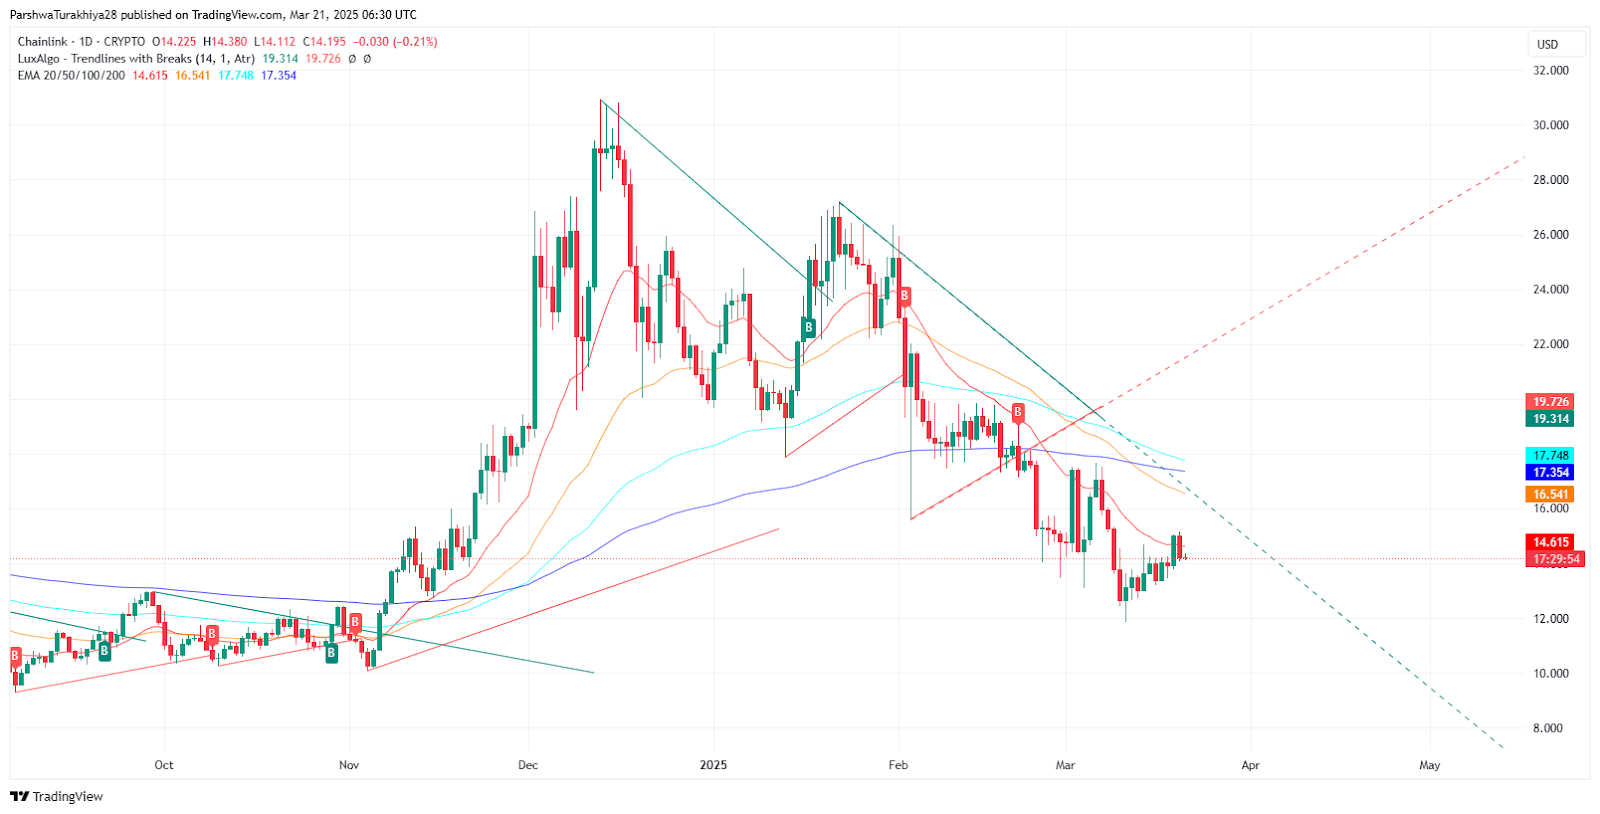
Chainlink (LINK) price analysis 2025 (Source: TradingView )
Chainlink (LINK) is poised for a potential price recovery throughout 2025. The technical indicators suggest a crucial year where LINK could establish new support zones and break key resistance levels.
Short-Term Outlook (Q1 – Q2 2025)
In the first half of 2025, Chainlink is expected to stabilize around its current support level of $14.25, which aligns with historical accumulation zones. The 20-day EMA at $14.61 is acting as a short-term pivot, and if LINK successfully holds this level, it could push toward the $16.50 – $17.75 range, which aligns with the 50-day and 100-day EMAs.
A successful breach above $17.75 would signal a potential shift in momentum, targeting the $19.30 – $20.00 resistance zone. However, if LINK fails to hold the $14.25 support level, it may revisit $12.50 – $13.50 before attempting another breakout.
Mid-Term Outlook (Q3 2025)
By mid-2025, LINK could witness increased adoption and investor interest, pushing its price toward an average of $22.37. The 200-day EMA at $17.35 will be a crucial resistance level. A breakout above this would confirm a bullish transition, potentially leading to a sustained rally toward the $24 – $26 range.
However, if the market remains neutral, LINK may consolidate between $18 – $22, awaiting stronger momentum. On the downside, $16.00 – $17.00 will act as a critical support range, preventing further declines.
Long-Term Outlook (Q4 2025)
If Chainlink maintains its bullish trajectory and breaks past the $25 – $27 range, it could reach its yearly high of $30.89. This level marks a key psychological and historical resistance zone where selling pressure may emerge. A strong breakout above $30 could open the door for price discovery, setting the stage for a move toward $35+ in early 2026.
However, failure to hold momentum above $28 – $30 could see LINK consolidating back toward the $22 – $25 range before another breakout attempt.
Final Prediction for 2025
- Potential Low: $14.25 – This level represents the lowest expected price, aligning with historical support zones and accumulation phases.
- Potential Average: $22.37 – LINK is expected to stabilize around this price range if it maintains steady growth and market demand.
- Potential High: $30.89 – If bullish momentum continues and Chainlink breaks key resistance levels, it could reach this peak before year-end.
Overall, Chainlink is positioned for a strong recovery in 2025, with potential upside toward $30+ if key technical levels are breached.
Chainlink (LINK) Price Prediction for 2026
Chainlink is expected to continue its bullish momentum in 2026, with prices ranging between $18.63 and $39.78. The projected average price of $28.47 suggests a steady uptrend, driven by increasing demand for decentralized oracle services. If LINK successfully breaks past the $30-$32 resistance zone, it could set the stage for a move toward $40. However, any major market corrections may push LINK to consolidate near $20 before its next breakout.
Chainlink (LINK) Price Prediction for 2027
With growing adoption of blockchain interoperability and smart contract automation, Chainlink’s utility could push its price between $22.94 and $50.52 in 2027. The expected average price of $36.82 reflects increased institutional adoption of decentralized finance (DeFi) and real-world asset tokenization. If LINK maintains strong on-chain activity, a surge beyond $45-$50 could mark a new cycle high, but profit-taking near $40 could trigger short-term retracements.
Chainlink (LINK) Price Prediction for 2028
By 2028, Chainlink could establish itself as a key infrastructure layer for Web3 applications, leading to a price range of $30.48 to $65.32. The projected average of $48.65 signals sustained long-term investor confidence. If LINK remains above the $40-$45 support zone, a breakout toward $60+ could be achievable, especially if staking mechanisms and institutional partnerships strengthen its tokenomics.
Chainlink (LINK) Price Prediction for 2029
As blockchain adoption accelerates, Chainlink could experience significant price expansion, trading between $38.75 and $85.46. The average price of $60.91 suggests LINK could become a dominant force in the DeFi and enterprise blockchain sectors. A move beyond $70 would likely require strong ecosystem developments, while any bearish sentiment could see LINK consolidating around $50-$55 before another push.
Chainlink (LINK) Price Prediction for 2030
By 2030, Chainlink’s price could range between $45.98 and $110.75, with an expected average of $78.23. This would be fueled by widespread adoption of smart contracts, deeper integration with financial institutions, and advancements in hybrid smart contract solutions. If LINK sustains momentum, a run beyond $100+ could solidify its position among the top blockchain projects. However, major corrections could see LINK finding support around $70-$75 before another upward push.
FAQs
LINK is expected to trade between $14.25 (low) and $30.89 (high), with an average price of $22.37 based on technical indicators and market trends.
Increased adoption in DeFi, partnerships, network upgrades, and improved market sentiment could drive LINK toward the $30+ level in 2025.
The key resistance zones are $17.75-$19.30 and $25-$28, with a strong breakout above $30 potentially leading to further price expansion.
While unlikely under bullish conditions, LINK could revisit $12-$13 if bearish sentiment dominates or if major market corrections occur.
Staking provides an incentive for LINK holders to lock tokens, reducing circulating supply and strengthening long-term demand.
Increased use of Chainlink’s oracle services across DeFi, AI automation, and traditional finance boosts LINK demand, supporting potential price appreciation.
While LINK may not reclaim its all-time high in 2025, a sustained bullish trend could position it for a strong rally toward $30-$35.
Regulatory uncertainty, competition in the oracle space, or market-wide downturns could slow LINK’s growth.
Chainlink’s integration in Web3, enterprise blockchain solutions, and DeFi suggests strong long-term potential, with higher valuations projected by 2030.
By 2030, LINK could trade between $45.98 and $110.75, with an average price of $78.23, assuming sustained adoption and ecosystem expansion.
Disclaimer: The information presented in this article is for informational and educational purposes only. The article does not constitute financial advice or advice of any kind. Coin Edition is not responsible for any losses incurred as a result of the utilization of content, products, or services mentioned. Readers are advised to exercise caution before taking any action related to the company.