Is Ethereum’s (ETH) Triangle Formation Pointing to a Major Breakout Similar to XRP’s Recent Surge?

Date: Mon, Jan 27, 2025, 04:11 AM GMT
The cryptocurrency market continues to face turbulence, with a 5% decline in Ethereum (ETH) and XRP (XRP) prices over the last 24 hours, reflecting broader market volatility. This comes amidst global market downturns and speculation around China’s newly launched Deep Seek AI Model, raising concerns about US tech dominance.
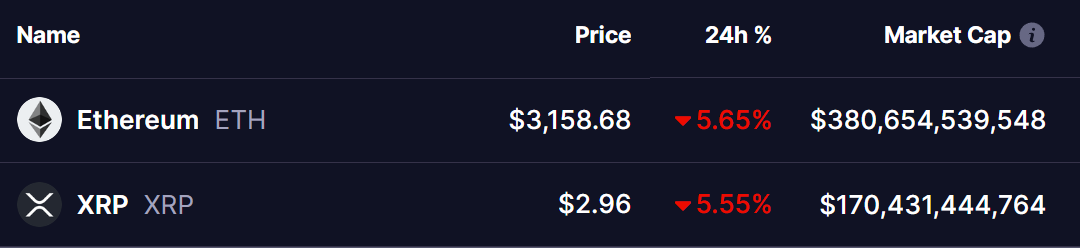 Source: Coinmarketcap
However, in the midst of this uncertainty, Ethereum’s price action is drawing significant attention, with some analysts pointing to a potentially bullish setup.
Ethereum (ETH) and XRP Chart Analysis
Crypto trader @Guardian1771_ recently shared insights indicating Ethereum may be following a path similar to XRP’s recent breakout.
 XRP-ETH CHART/Source: @Guardian1771_ (X)
In November 2024, XRP shattered a 7-year symmetrical triangle pattern, rallying 480% within 75 days. XRP’s price surged from $0.58 to $3.29, while its market capitalization skyrocketed from $30 billion to $195 billion during this period. This breakout demonstrated the immense potential of long-term technical patterns.
Ethereum, too, appears to be forming a symmetrical triangle, consolidating in a setup that could lead to a significant move. Analysts note that this pattern often indicates a balance of buying and selling pressure, which could resolve with a sharp price movement in either direction.
Ethereum’s Weekly Chart: Key Insights
Ethereum’s current trading level of $3,150 shows it navigating a falling wedge pattern within the larger symmetrical triangle. This wedge is marked by converging trendlines, which are pivotal for determining ETH’s next move.
 Ethereum (ETH) W Chart/Coinsprobe (Source: Tradingview)
Key Technical Levels:
- Support Levels:
- The 50-day Simple Moving Average (SMA) is acting as immediate support.
- The 100-day SMA aligns with the ascending support of the triangle, providing additional stability.
- Resistance Levels:
- The falling wedge’s upper boundary presents the first hurdle for ETH.
- If ETH breaks out of this wedge, it could approach the triangle’s descending resistance, which marks a critical area for bullish confirmation.
A breakout beyond the falling wedge and subsequent move toward the descending triangle resistance would signal a potential shift in momentum. Should ETH clear this resistance, a rally similar to XRP’s November surge could be in play.
Final Thoughts
While Ethereum has struggled to generate upside momentum recently, its symmetrical triangle and falling wedge formations suggest a promising long-term outlook. A successful breakout from the wedge could set ETH on a path toward testing and potentially surpassing the triangle’s descending resistance, paving the way for significant price gains.
However, traders should remain cautious. Confirmation of the breakout, accompanied by volume and sustained price action, is critical before making any investment decisions. As always, consider the inherent risks in the cryptocurrency market and conduct thorough research.
Disclaimer: This article is for informational purposes only and does not constitute financial advice. Always consult with a financial advisor before making any investment decisions.
Disclaimer: The content of this article solely reflects the author's opinion and does not represent the platform in any capacity. This article is not intended to serve as a reference for making investment decisions.
You may also like
PEPE Shows Strong Bottoming Signals—Is It Gearing Up for Another 10x Surge Like in February/March 2024?

Algorand (ALGO) Testing Key Bullish Pennant Support: Will It Make a Bounceback?

Why Major Altcoins Including XRP, XLM, and HBAR Are Facing a Significant Decline—Is a Bounceback Ahead?

Cardano (ADA) Testing Key Support in Bullish Pennant – Is a Bounceback Coming?
