U.S. Election Impact on Bitcoin: Will Historical Election Day Price Trends Predict the Next Rally?
- Despite a surge past $73,000, Bitcoin faces resistance, retreating to $67,000 as market optimism begins to wane.
- Bitcoin’s struggle near $74,000 contrasts with BlackRock’s IBIT success, hinting at limited new investment in Bitcoin ETFs.
As the U.S. election approaches, financial analysts and investors are closely monitoring Bitcoin and other cryptocurrencies for potential price movements following the announcement of election results.
This focus stems from a historical pattern observed in Bitcoin’s price behavior on U.S. election days , which has consistently set a minimum price level for subsequent market rallies.
Bitcoin After U.S. Elections
🔸Bitcoin has alway gone PARABOLIC after a US election.
🔸Bitcoin has never dipped back lower than the price on election day.
Locked & Loaded 🔥🔫 pic.twitter.com/nt7GnVV5lN
— Bitcoin Archive (@BTC_Archive) November 2, 2024
Historical data shows that Bitcoin’s price on U.S. election days has established a base that has not been undercut in the succeeding market phases. For example, during the 2020 election, Bitcoin was priced at $13,569.
Subsequent months saw a significant increase, with Bitcoin reaching a peak of over $69,000 in 2021. This price point from election day served as a support level even during the 2022 bear market, underscoring its importance as a foundational price marker.
The election’s outcome could significantly influence the cryptocurrency market, as different candidates have varying stances on blockchain technology and cryptocurrency regulations. These positions could lead to shifts in the regulatory landscape affecting the cryptocurrency market’s direction post-election.
If the historical trend continues, Bitcoin might experience another substantial rally following the election. This potential is based on observed patterns from past election cycles where Bitcoin has shown robust gains after the election day price was established.
Bitcoin’s Weekly Chart Indicator
Bitcoin, recognized as the predominant cryptocurrency by market value, recently showcased a “gravestone Doji” candle on its weekly chart, signaling potential bearish outcomes.
Uhhhh g-guys…
Are we sure that we wanna close the weekly like this? 😳 $BTC pic.twitter.com/EW5djUUPeA
— Byzantine General (@ByzGeneral) November 3, 2024
This pattern is marked by a pronounced upper shadow, demonstrating that bearish forces neutralized bullish efforts within the week, culminating in a closing price akin to its opening, after initially soaring higher.
Market Reactions and Speculations
The emergence of this pattern coincides with Bitcoin’s attempt to breach the $73,000 mark, a move that briefly positioned it above previous monthly highs. Nonetheless, this rally was met with resistance, leading to a regression to the $67,000 level.
Analysts note that the subdued breakthrough beyond $74,000, in contrast to the expected trajectory mirrored by notable financial instruments like BlackRock’s IBIT, might stem from the minimal fresh capital inflows into Bitcoin ETFs, especially when juxtaposed with gold ETFs.
$BTC 4H starting to breach lower BB https://t.co/wSANMIl70D pic.twitter.com/ZTnAMnMqJW
— Cheds (Trading Quotes) (@BigCheds) November 3, 2024
On the technical front, Bitcoin has dipped below the lower boundary of the Bollinger Bands on a four-hour chart, an indication that might concern bullish investors. However, a sliver of optimism is observed with a bullish divergence on the one-hour chart, suggesting a weakening bearish momentum.
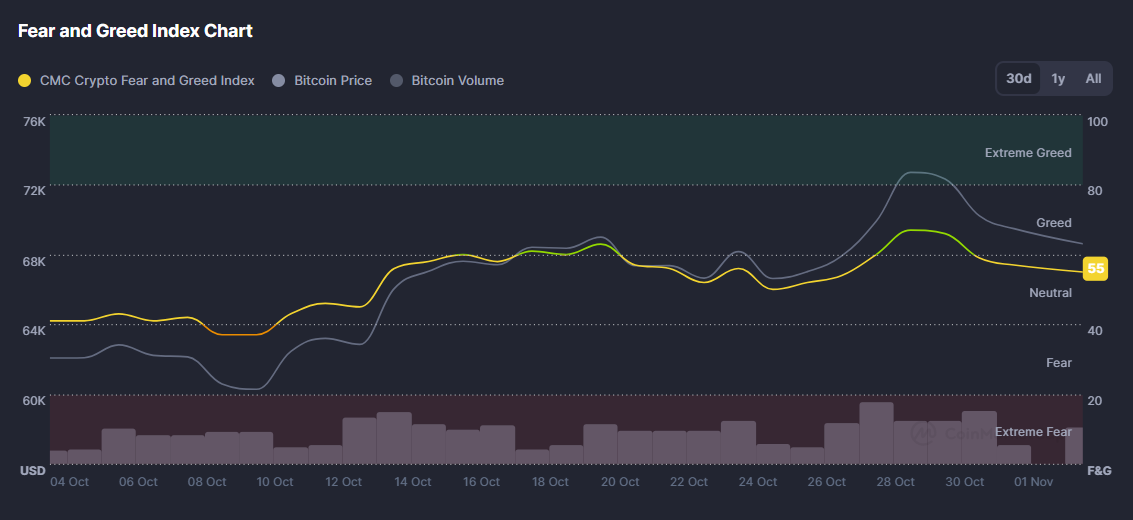
 Source: Coinmarketcap
Despite these technical indicators, the overall market sentiment remains relatively optimistic, as indicated by the “Fear and Greed” index still scoring a robust 54 out of 100. This reflects a prevailing investor confidence, hinting that the broader market sentiment hasn’t fully aligned with the bearish indicators from the weekly chart.
Disclaimer: The content of this article solely reflects the author's opinion and does not represent the platform in any capacity. This article is not intended to serve as a reference for making investment decisions.
You may also like
Indiana Moves to Allow Bitcoin in Pension Funds as States Eye Crypto Reserves

Grayscale Expands Crypto Offerings with Bitcoin Miners ETF

Bitcoin Holds Strong Above $100K While Altcoins Struggle – What’s Next?

Bitcoin’s Price Moves Like Small Tech Stocks, Says JPMorgan

